Mobile Soil Sampling on iPhone & iPad
If you've ever walked a field with a clipboard in one hand, a handheld GPS in the other, and a stack of sample bags in your vest pockets, you know the drill: write down the sample ID, squint at the GPS screen, scribble coordinates on a mud-smeared form, and hope you can read it all later when you're back at the truck.
There's a better way. Your iPhone or iPad already has a GPS receiver, a camera, a barcode scanner, and a screen you can actually read. GoGIS turns it into a purpose-built soil sampling tool — and not just for a single trip. It's built around the way sampling actually works: a program you run season after season, where the same points get re-sampled on a schedule and you always need to know what's done and what's still owed.
The Problem with Traditional Sampling
Traditional soil sampling workflows involve multiple disconnected tools: a handheld GPS for navigation, paper forms for data entry, a separate list for sample IDs, and a laptop back at the office to pull it all together. Data gets transcribed two or three times, and every transcription is a chance for error. Bag labels get swapped, coordinates get transposed, and by the time the lab results come back, nobody's sure which sample came from where.
It gets harder once sampling repeats. A field sampled last fall is due again — but which points have you re-collected this season, and which are still outstanding? Across dozens of fields, that question is almost impossible to answer from a pile of paper. The program, not the single trip, is where things fall apart.
One Device, One Program
GoGIS collapses the whole workflow into a single device and a single app — and keeps the thread across seasons. You generate a grid once, collect against it, and the app tracks which points are current, which have expired, and which were never visited. Here's how it works in practice:
1. Set Up Your Field Boundary
Load your field boundaries from a shapefile, GeoPackage, or KML file — whatever your farm management software or agronomist provides. The polygons become the containers for your sample grid.
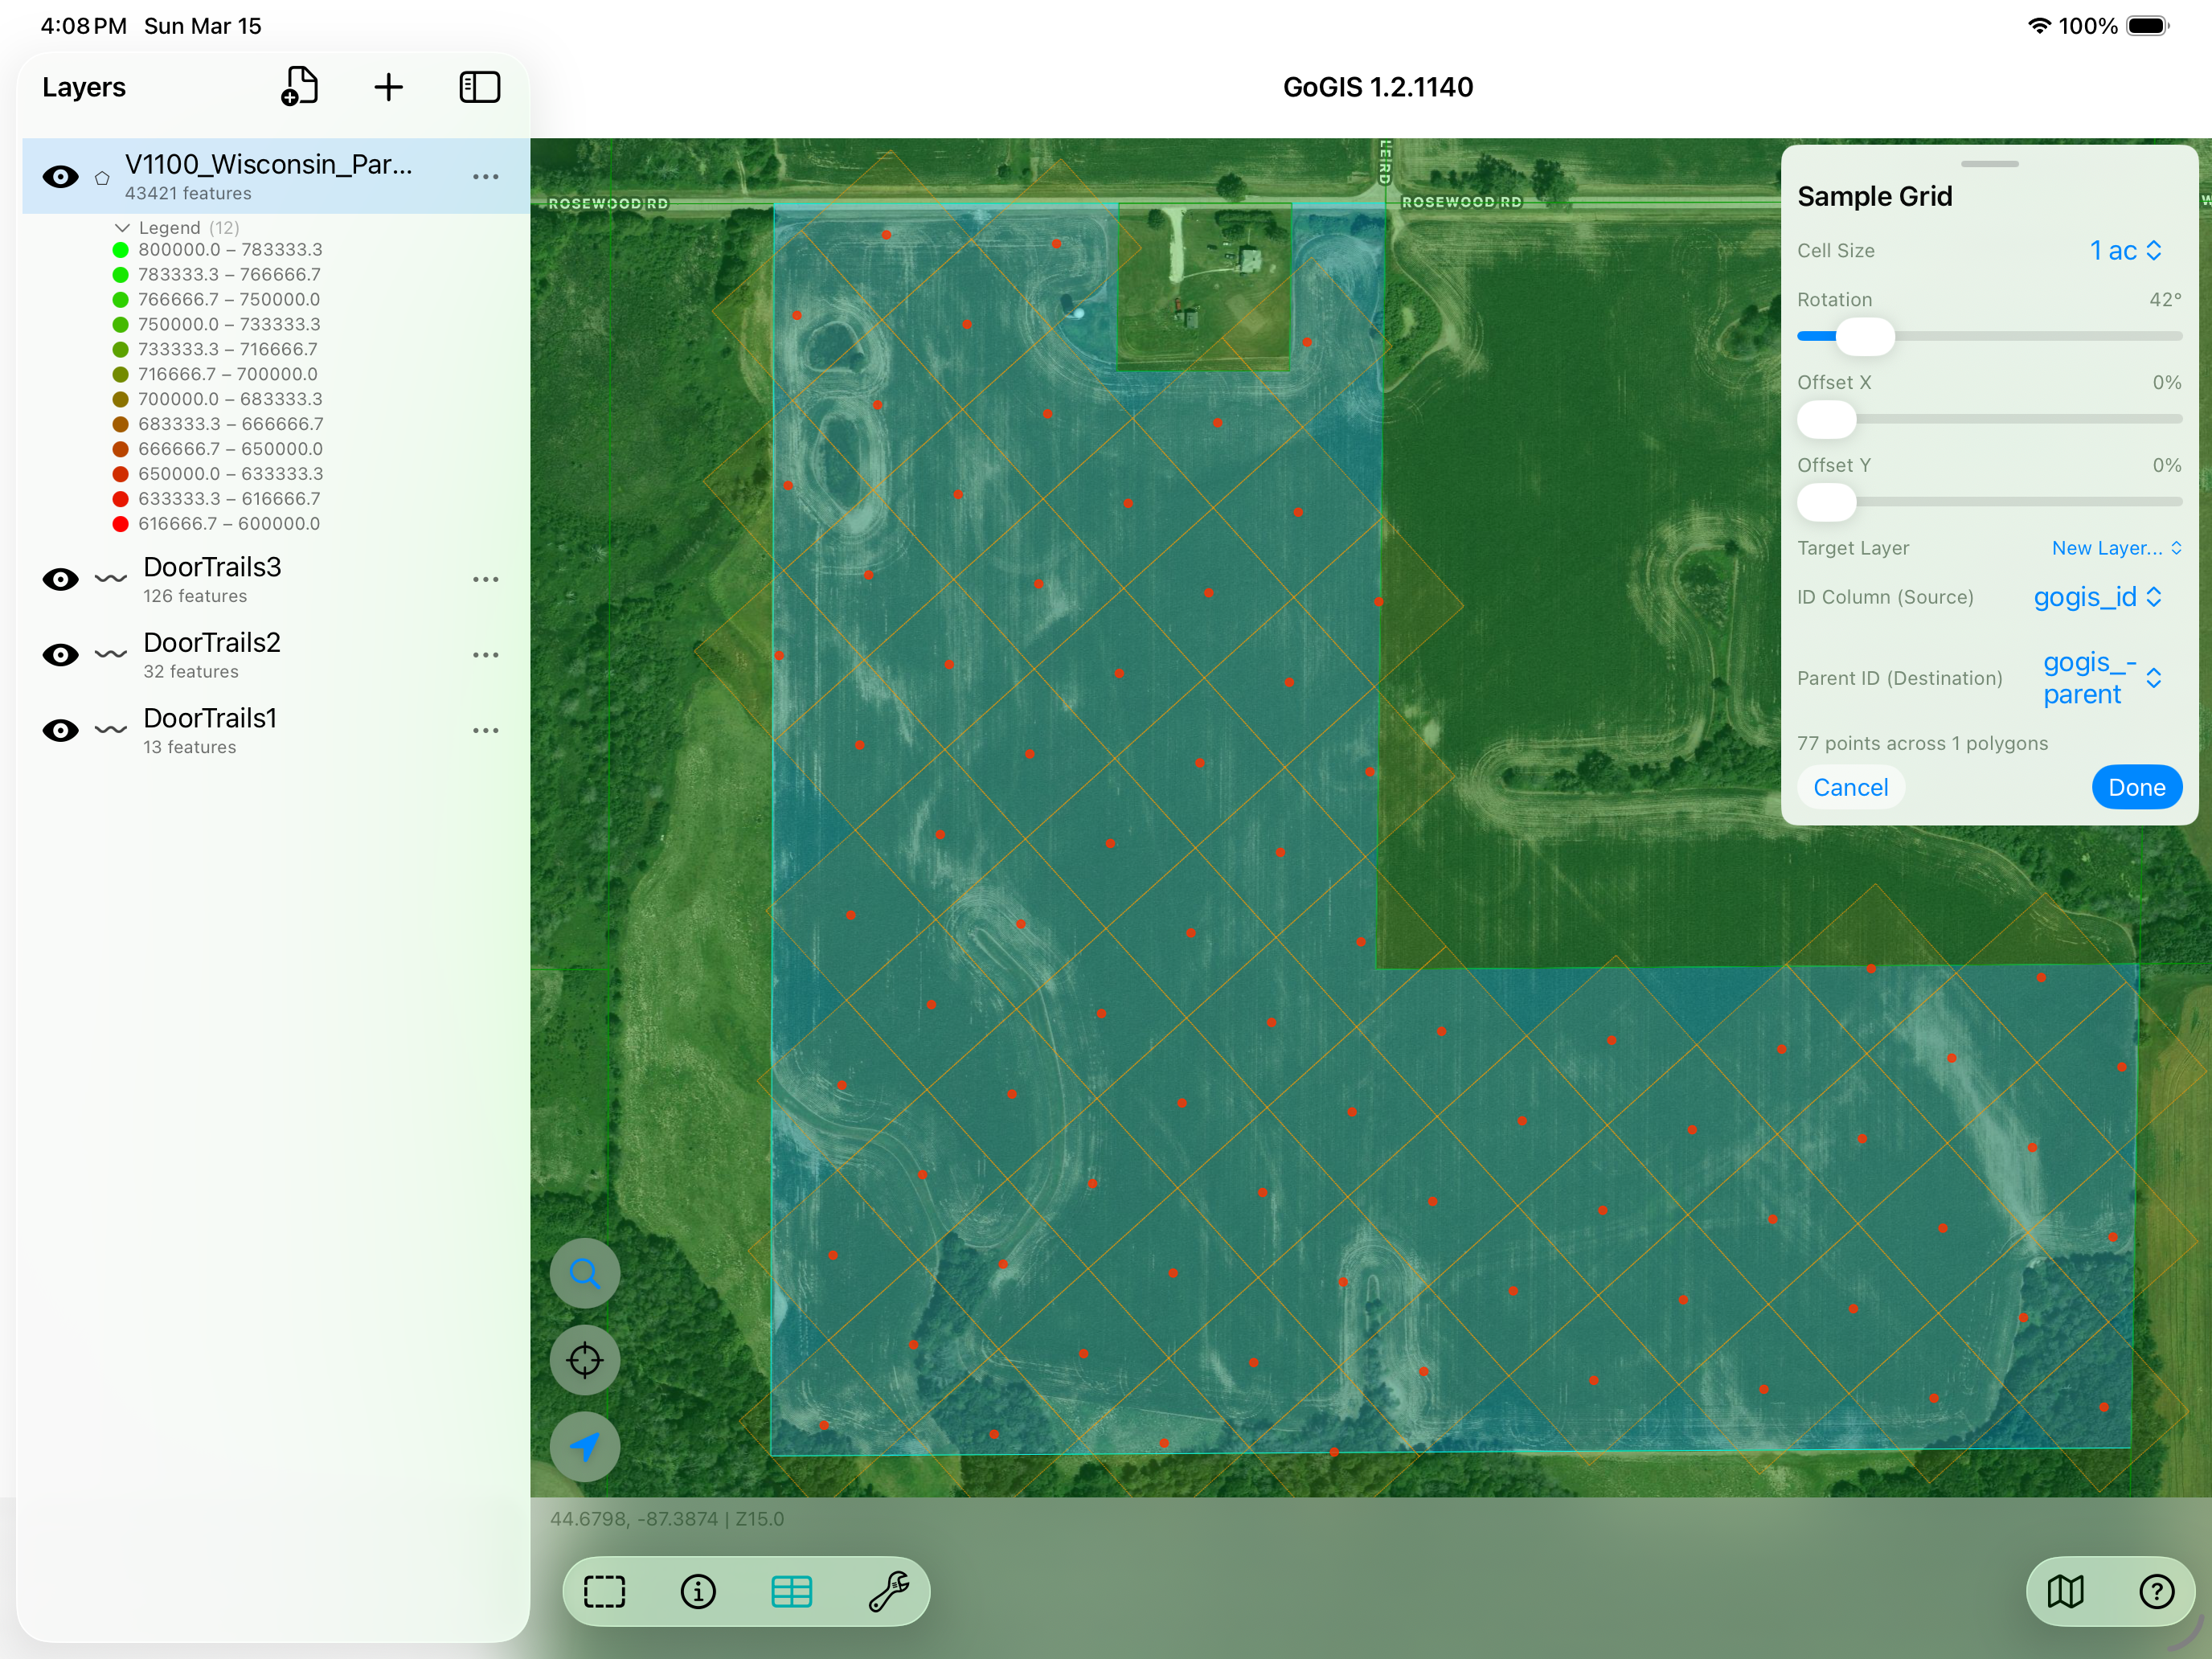
2. Generate the Sample Grid
Select your field polygon and tap the sampling tool. GoGIS generates a numbered grid of sample points inside the boundary. You control the cell size in acres or hectares, and you can adjust the grid rotation and offset to align with rows or avoid obstacles. Each point gets a sequential ID automatically.
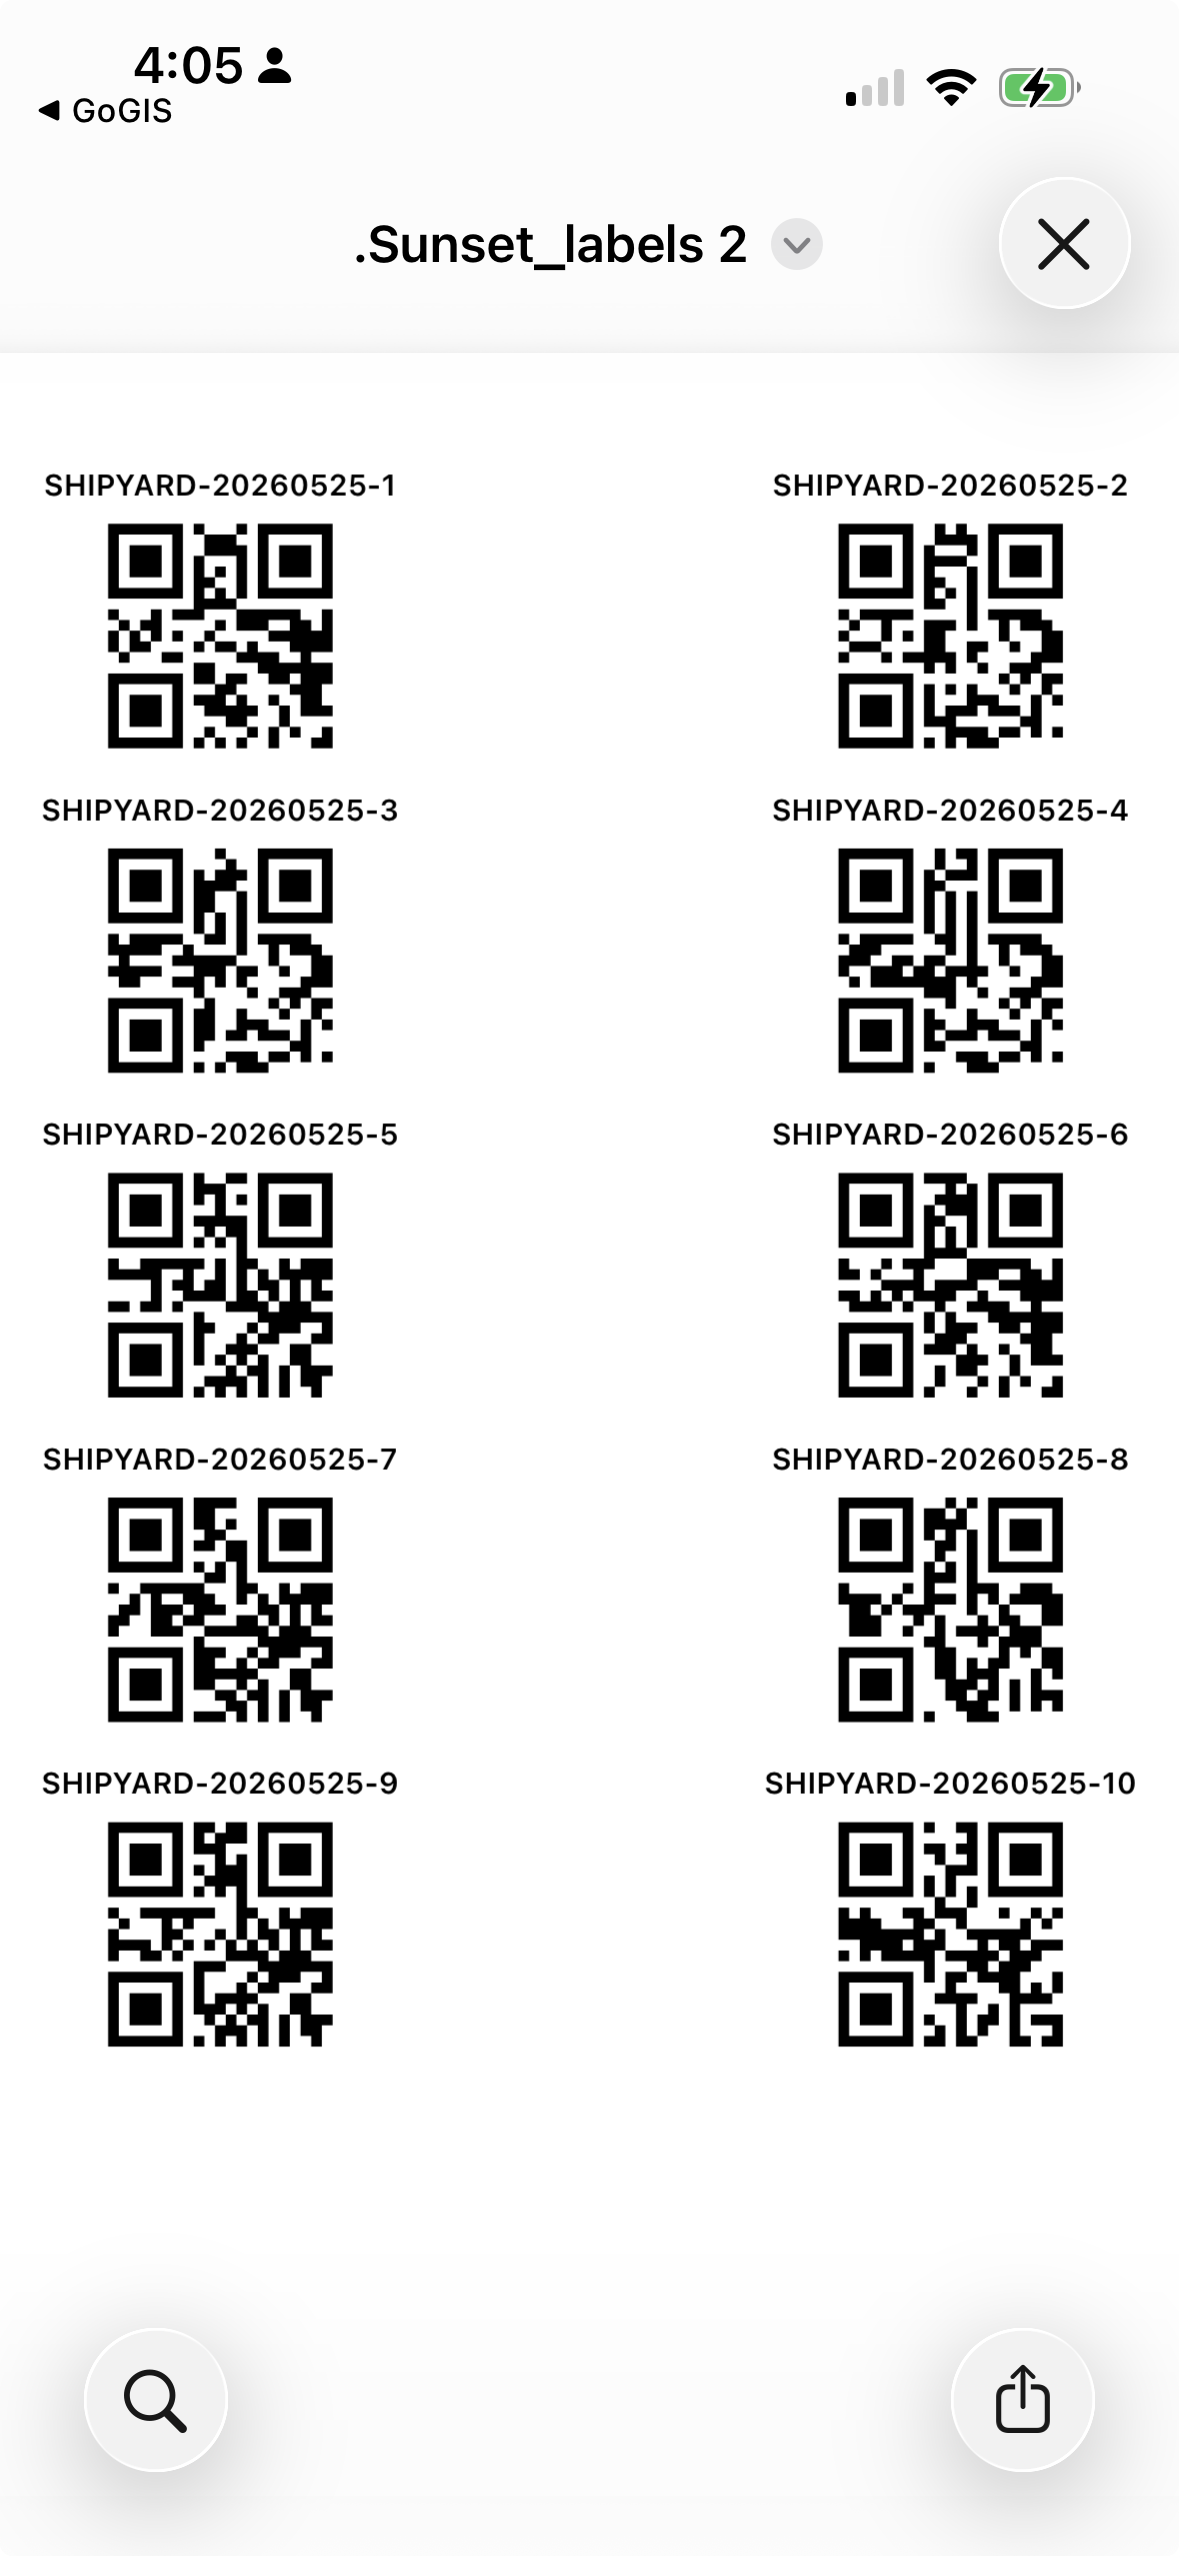
3. Print QR Bag Labels
Before you head out, print peel-and-stick labels for your sample bags right from the app. GoGIS lays out a sheet of QR codes (or Code 128 barcodes) on A4 or US Letter — and you choose what goes on each label: a field name pulled from the boundary, the date, and the sample number or your own Bag ID. Stick one on each bag, then scan it back when you collect so every bag stays tied to the exact point it came from.
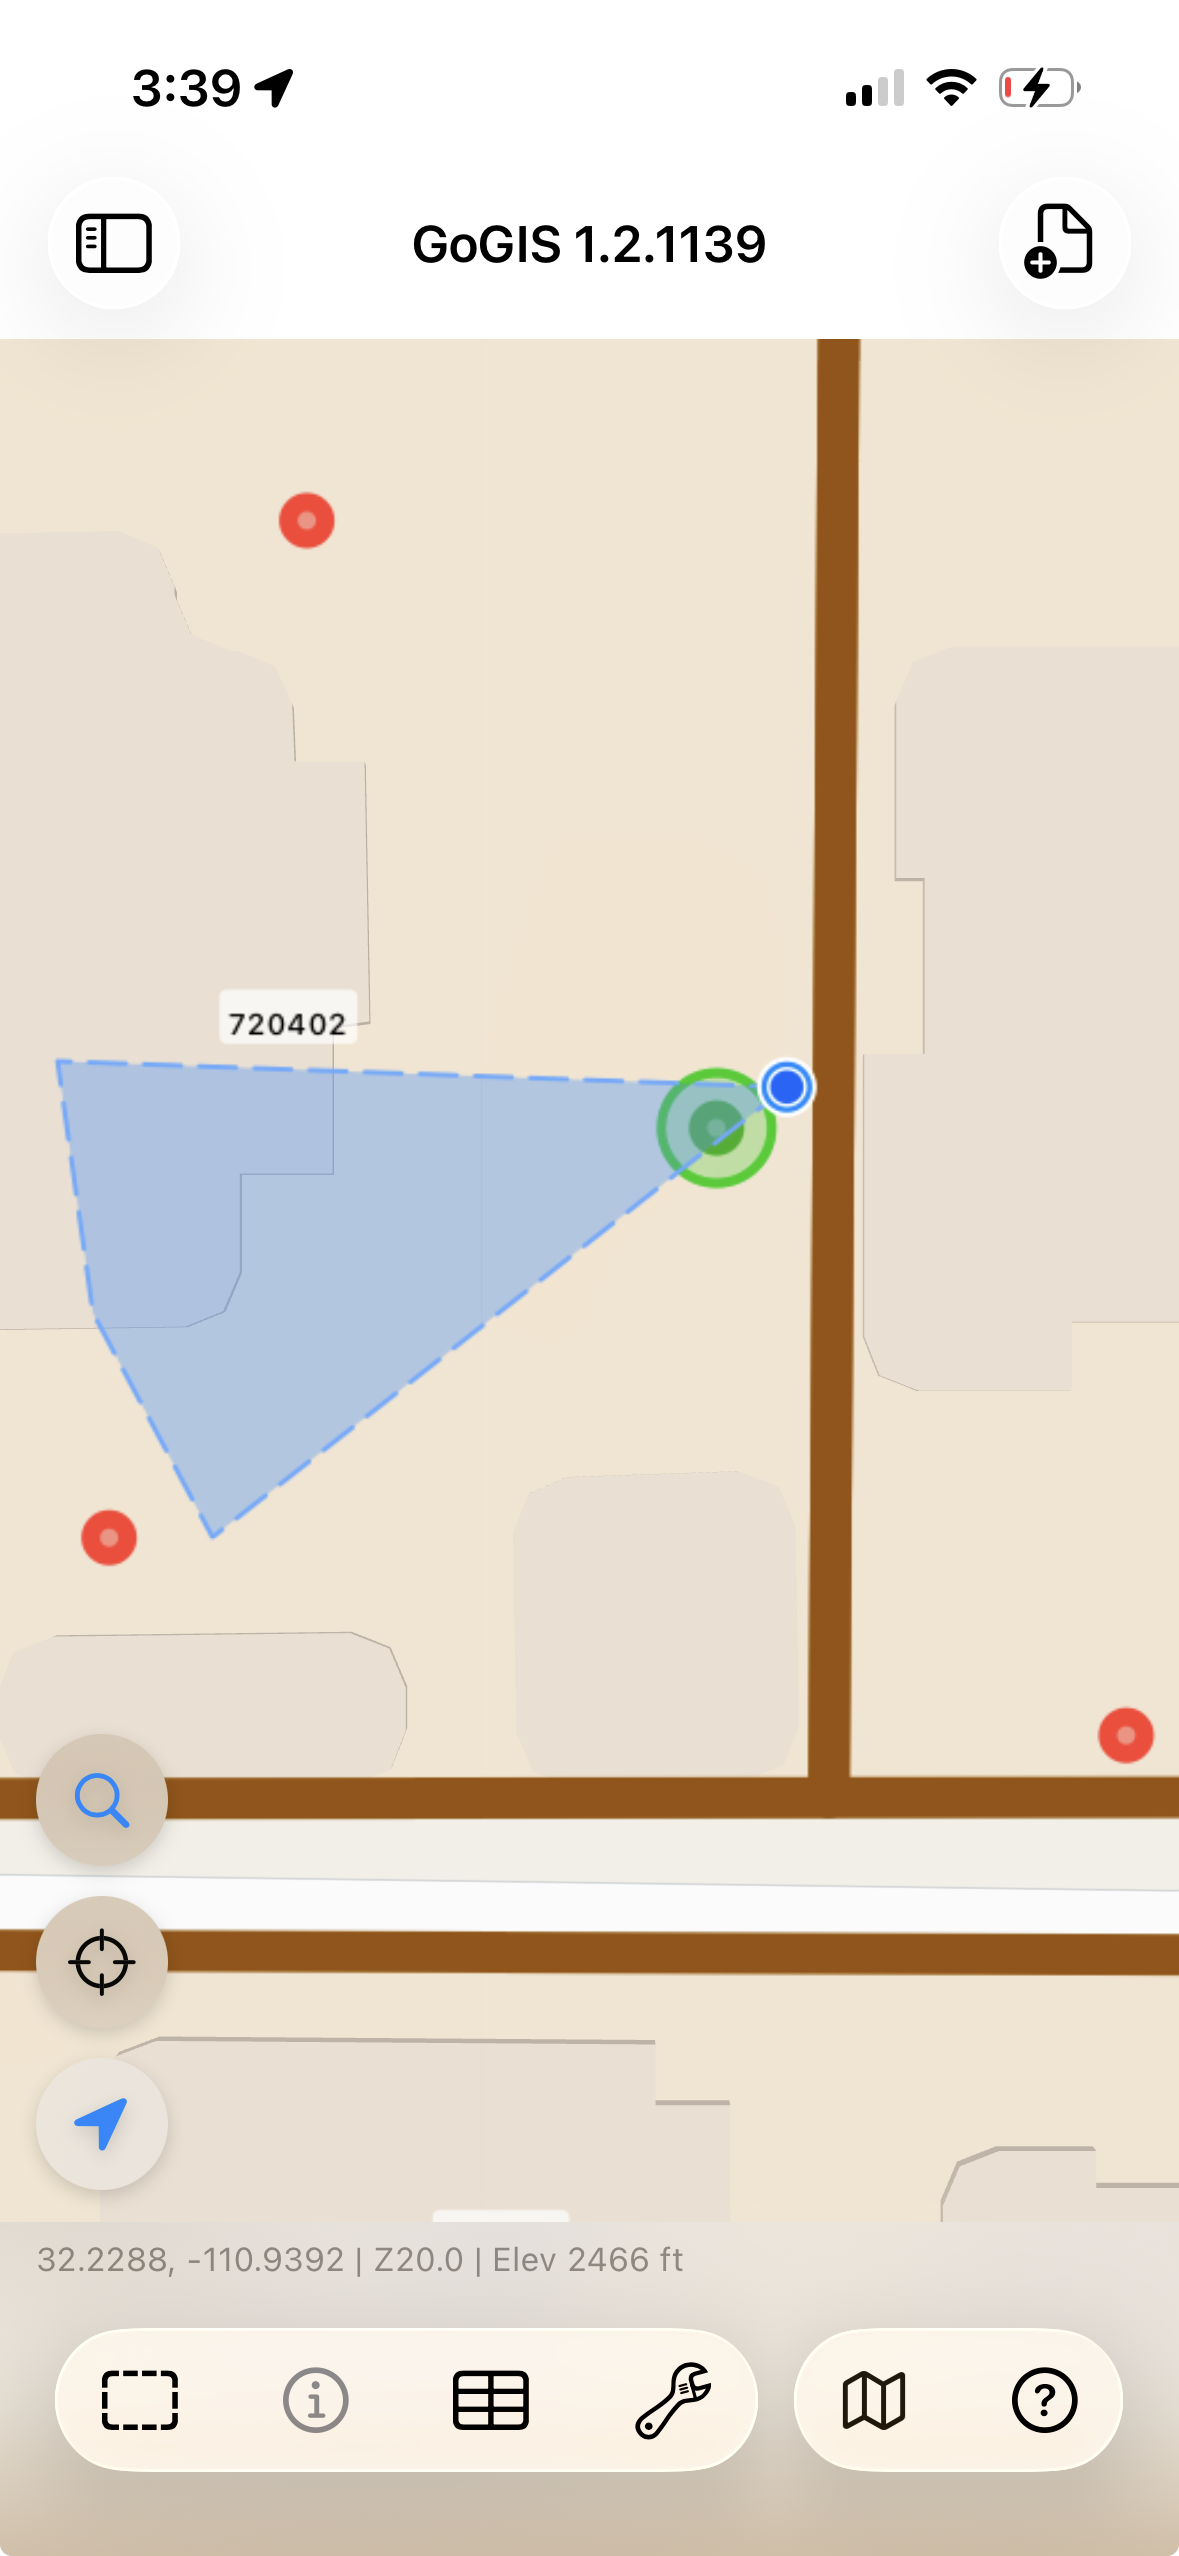
4. Walk to Each Point with GPS
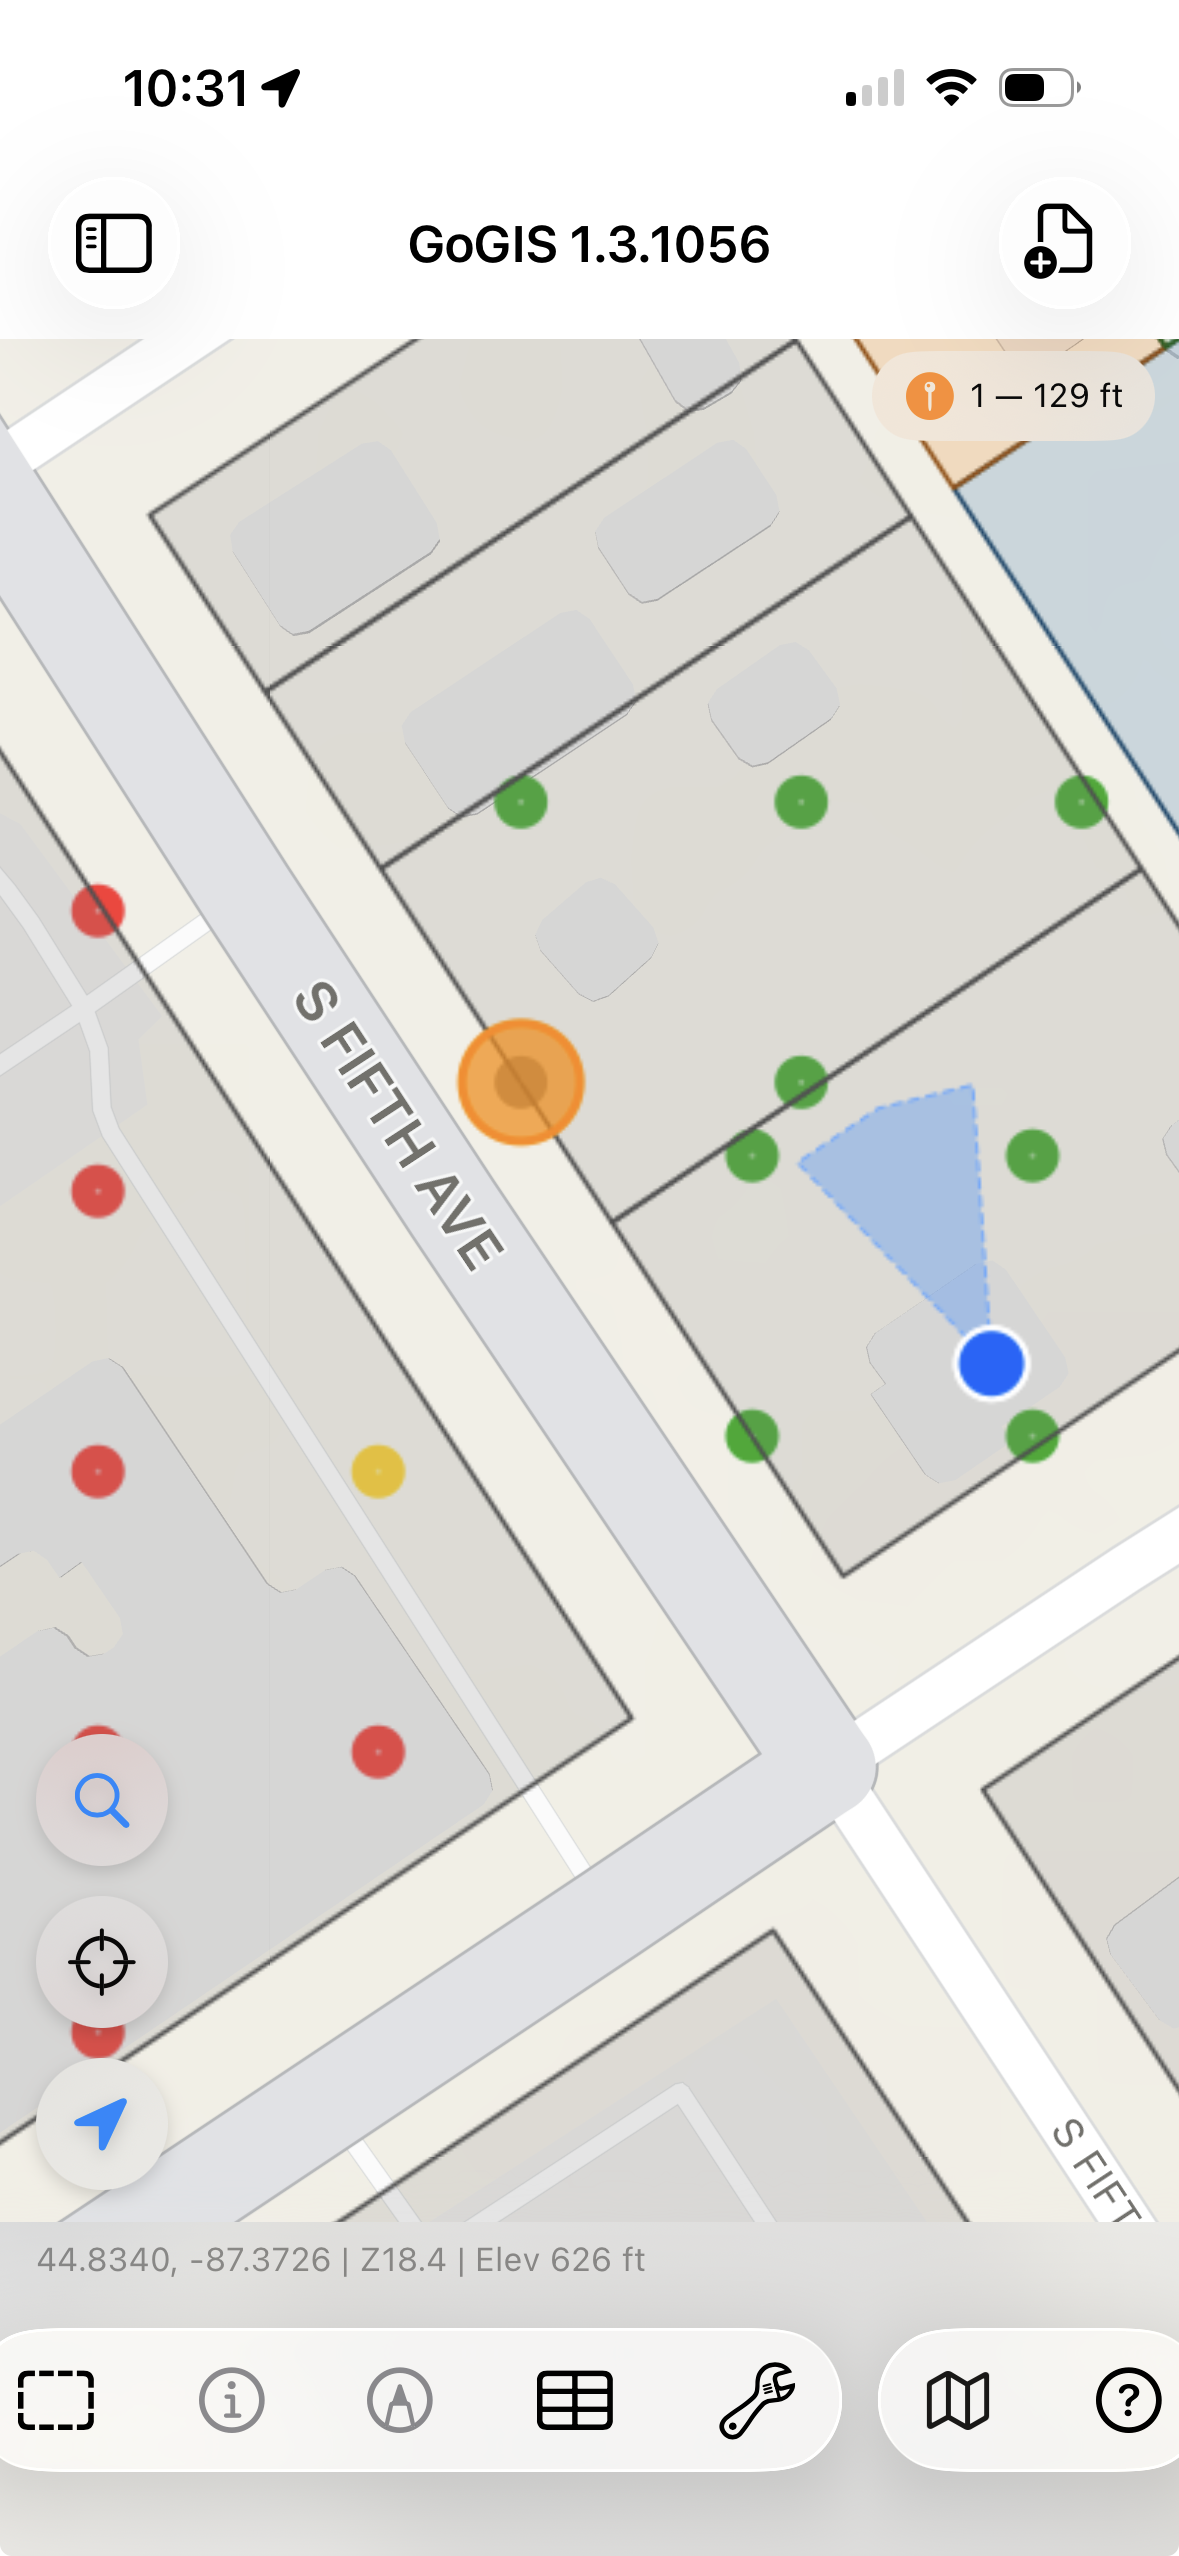
With the grid generated, head into the field. GoGIS shows your live GPS position on the map with a proximity circle around the nearest sample point. Walk toward it — the display updates in real time. When you're close enough, the nearest point highlights green so you know you're in the right spot.
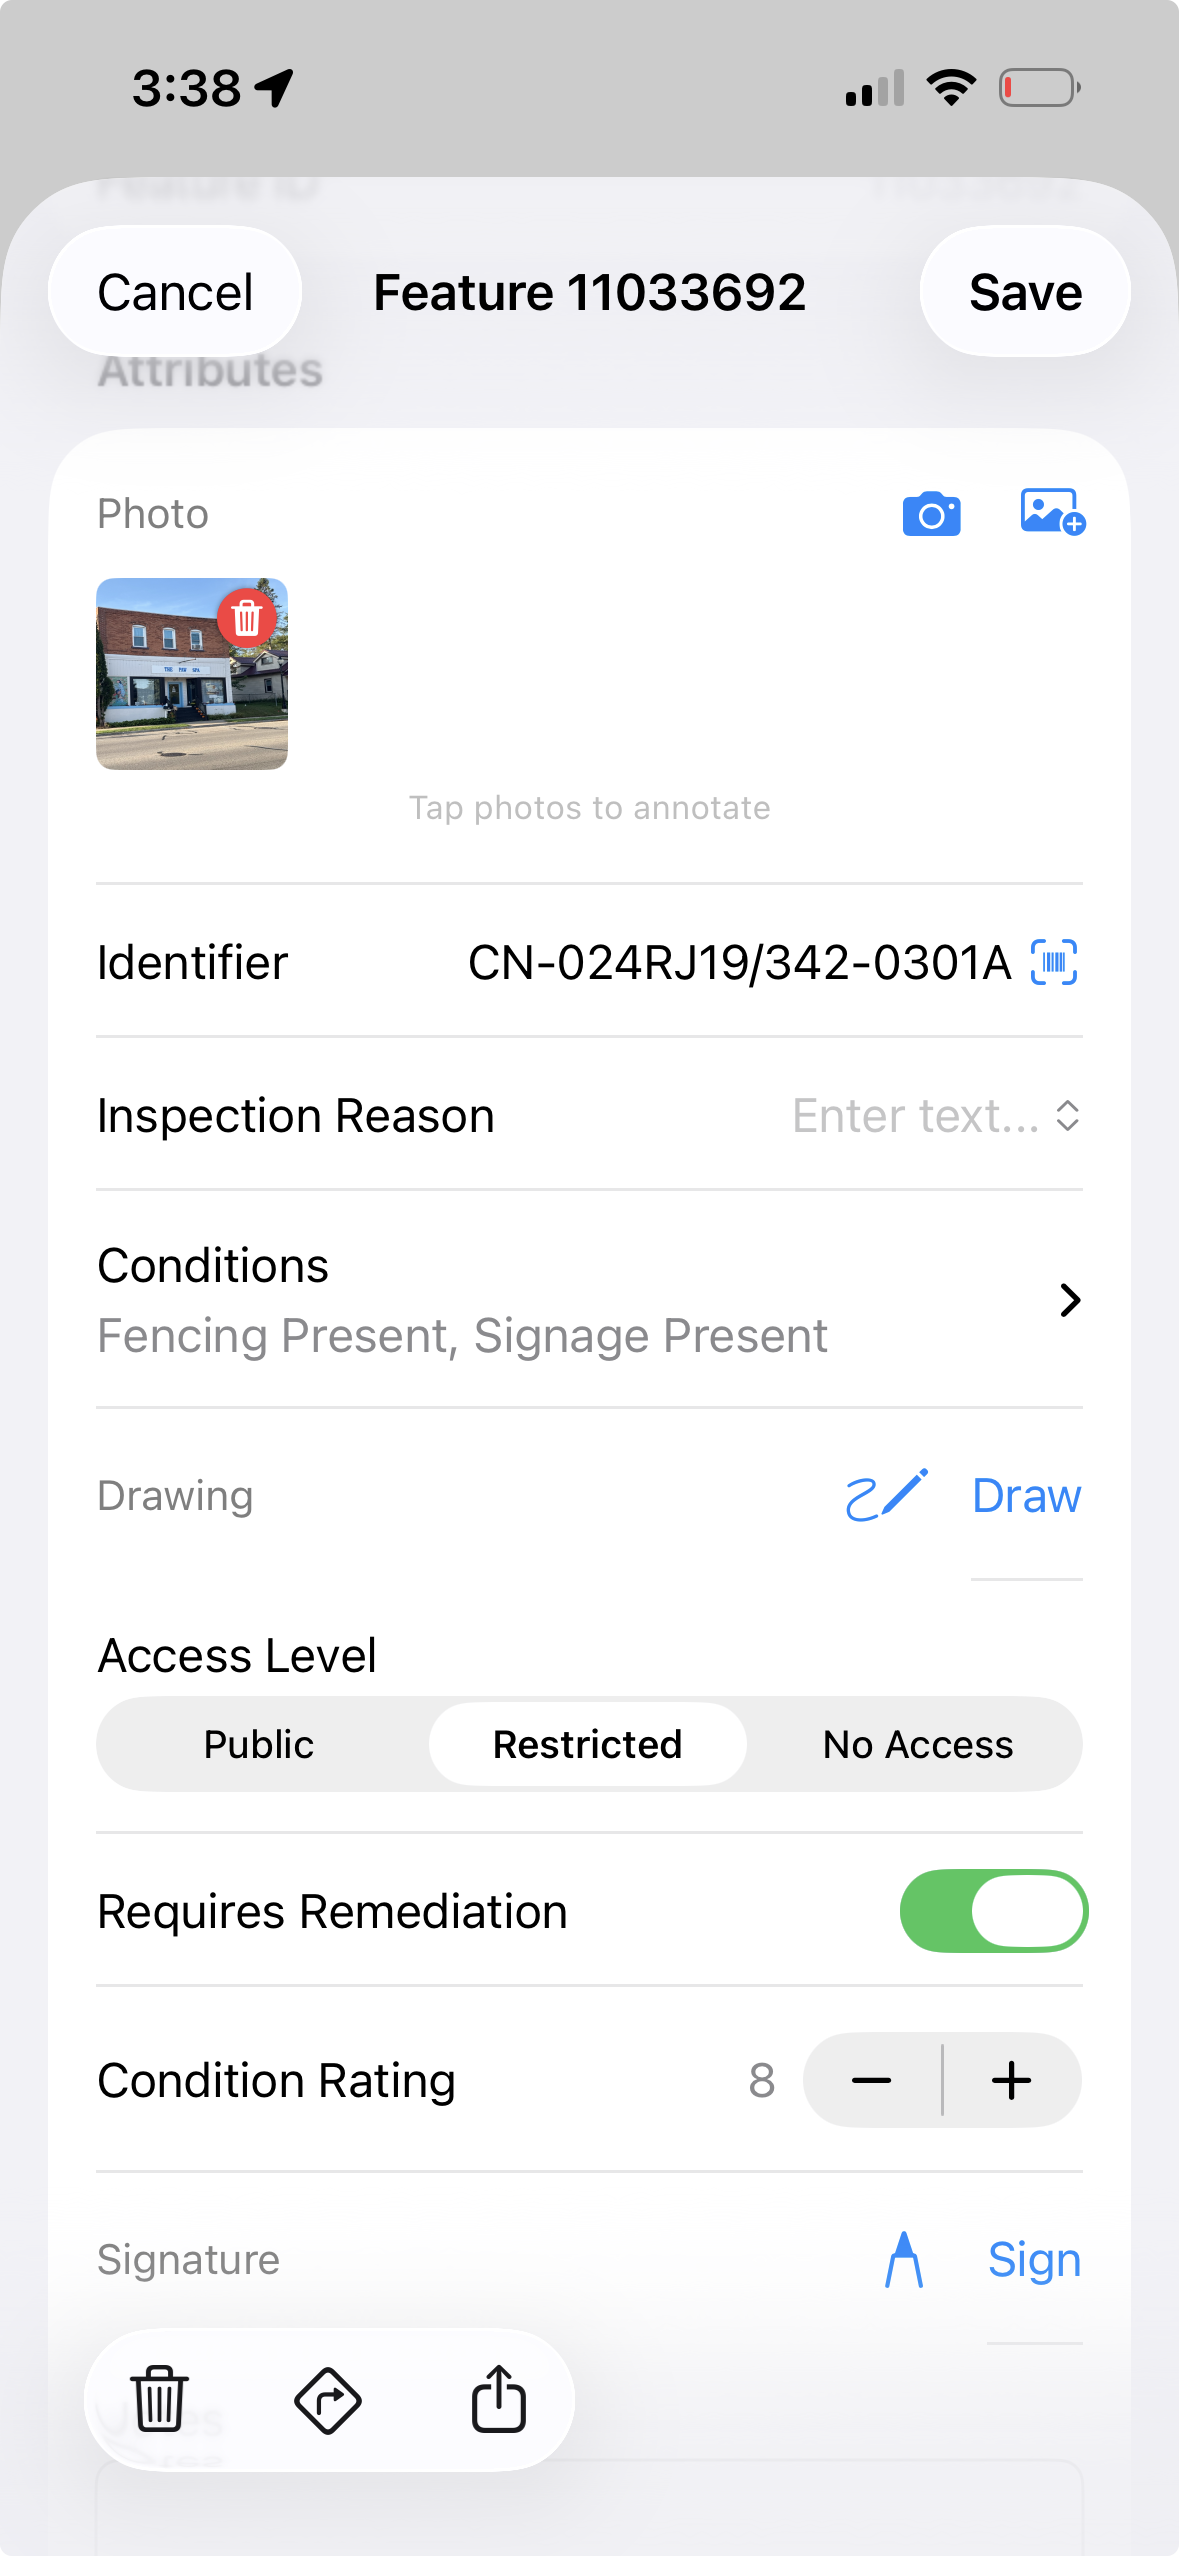
5. Collect Your Data
Tap the sample point to open the attribute form. Fill in your observations — soil color, texture, moisture, depth, whatever fields you've defined. Scan the barcode on your sample bag directly into a text field — look for the barcode icon next to any text field to activate the scanner. Snap a photo of the core or the site conditions. Hit save, and the point changes color to show it's been collected — see freshness below for what the colors mean.
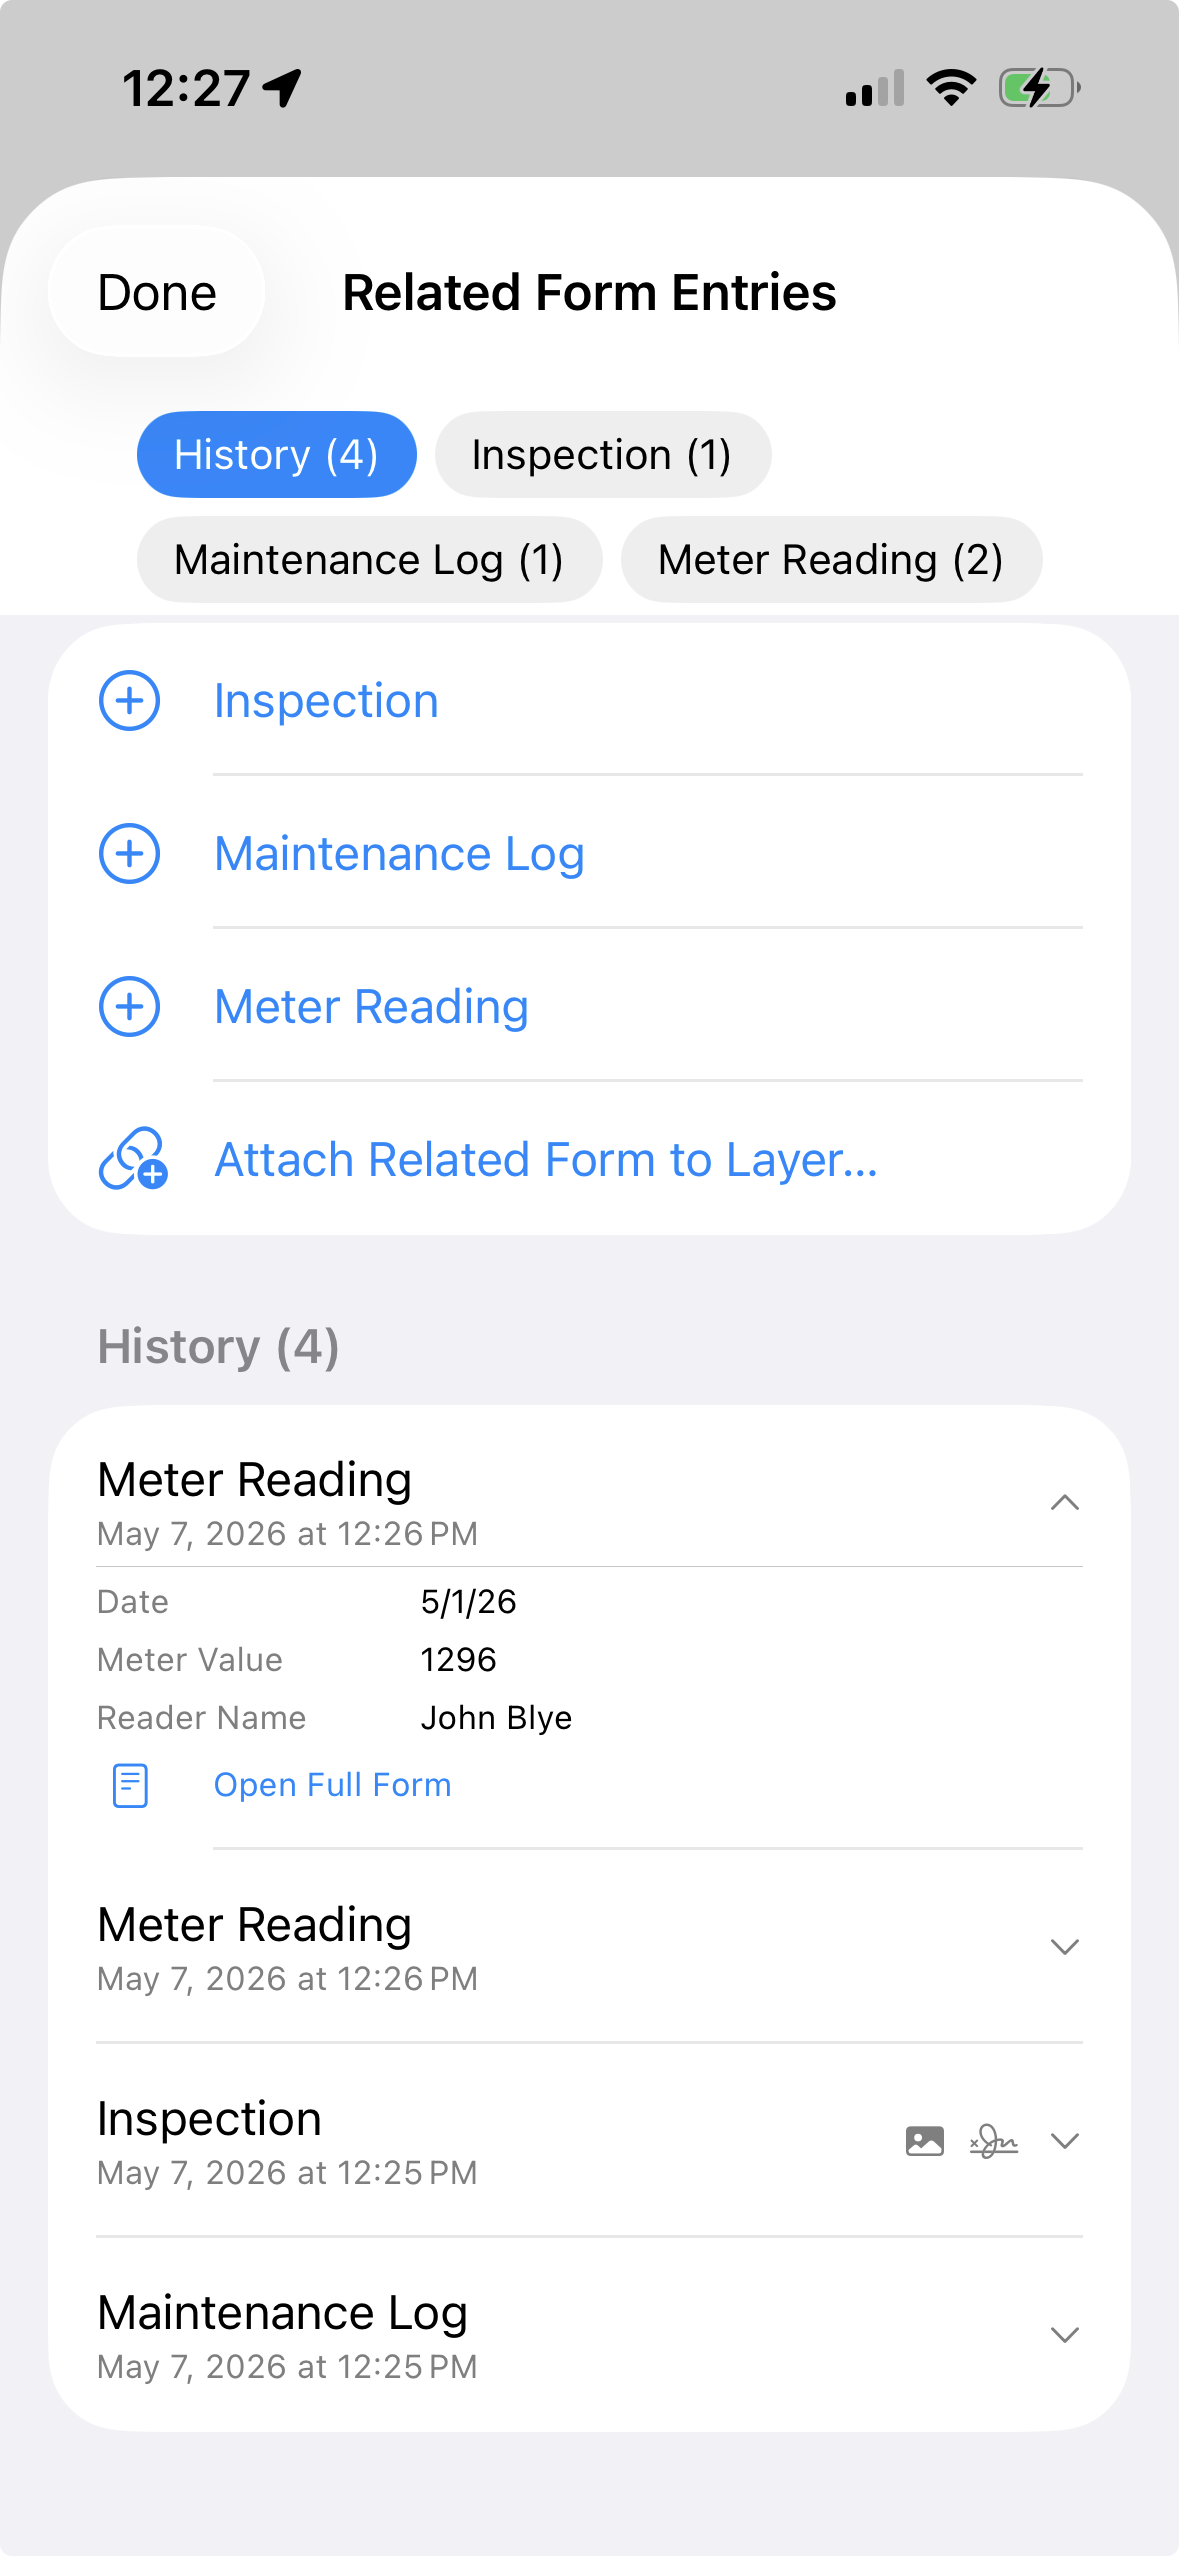
6. Capture Repeat Visits with Related Forms
Sometimes one record per point isn't enough. A point might get re-tested, inspected, or re-cored on separate dates, and you want every visit kept — not overwritten. Attach a related form to your sampling layer and each collection adds a new dated entry linked to that point, with its own photos and fields. The sample's identity rides along with every entry, so an inspection from March and a re-test in October both stay tied to the same point and the same sample number.
7. Track Freshness and Re-Sample Across Seasons
This is what turns a one-time grid into an ongoing program. Set an expiration window — say, one season or twelve months — and GoGIS colors every point by its status:
- Red — never sampled: no collection on record yet. (This is the layer's own point color, so you can change it to suit your map.)
- Green — fresh: collected within the window. You're current here.
- Orange — expired: collected, but older than the window. Due to re-sample.
The orange "expired" state only appears once you've set an expiration window — without one, points are simply unsampled (red) or sampled (green), and nothing ages out. When you do set a window, fresh points quietly revert to expired as it passes, and the same grid is ready for the next round with no need to regenerate anything. Walk the field again and you can see at a glance which points still need a fresh core this season and which are already done.
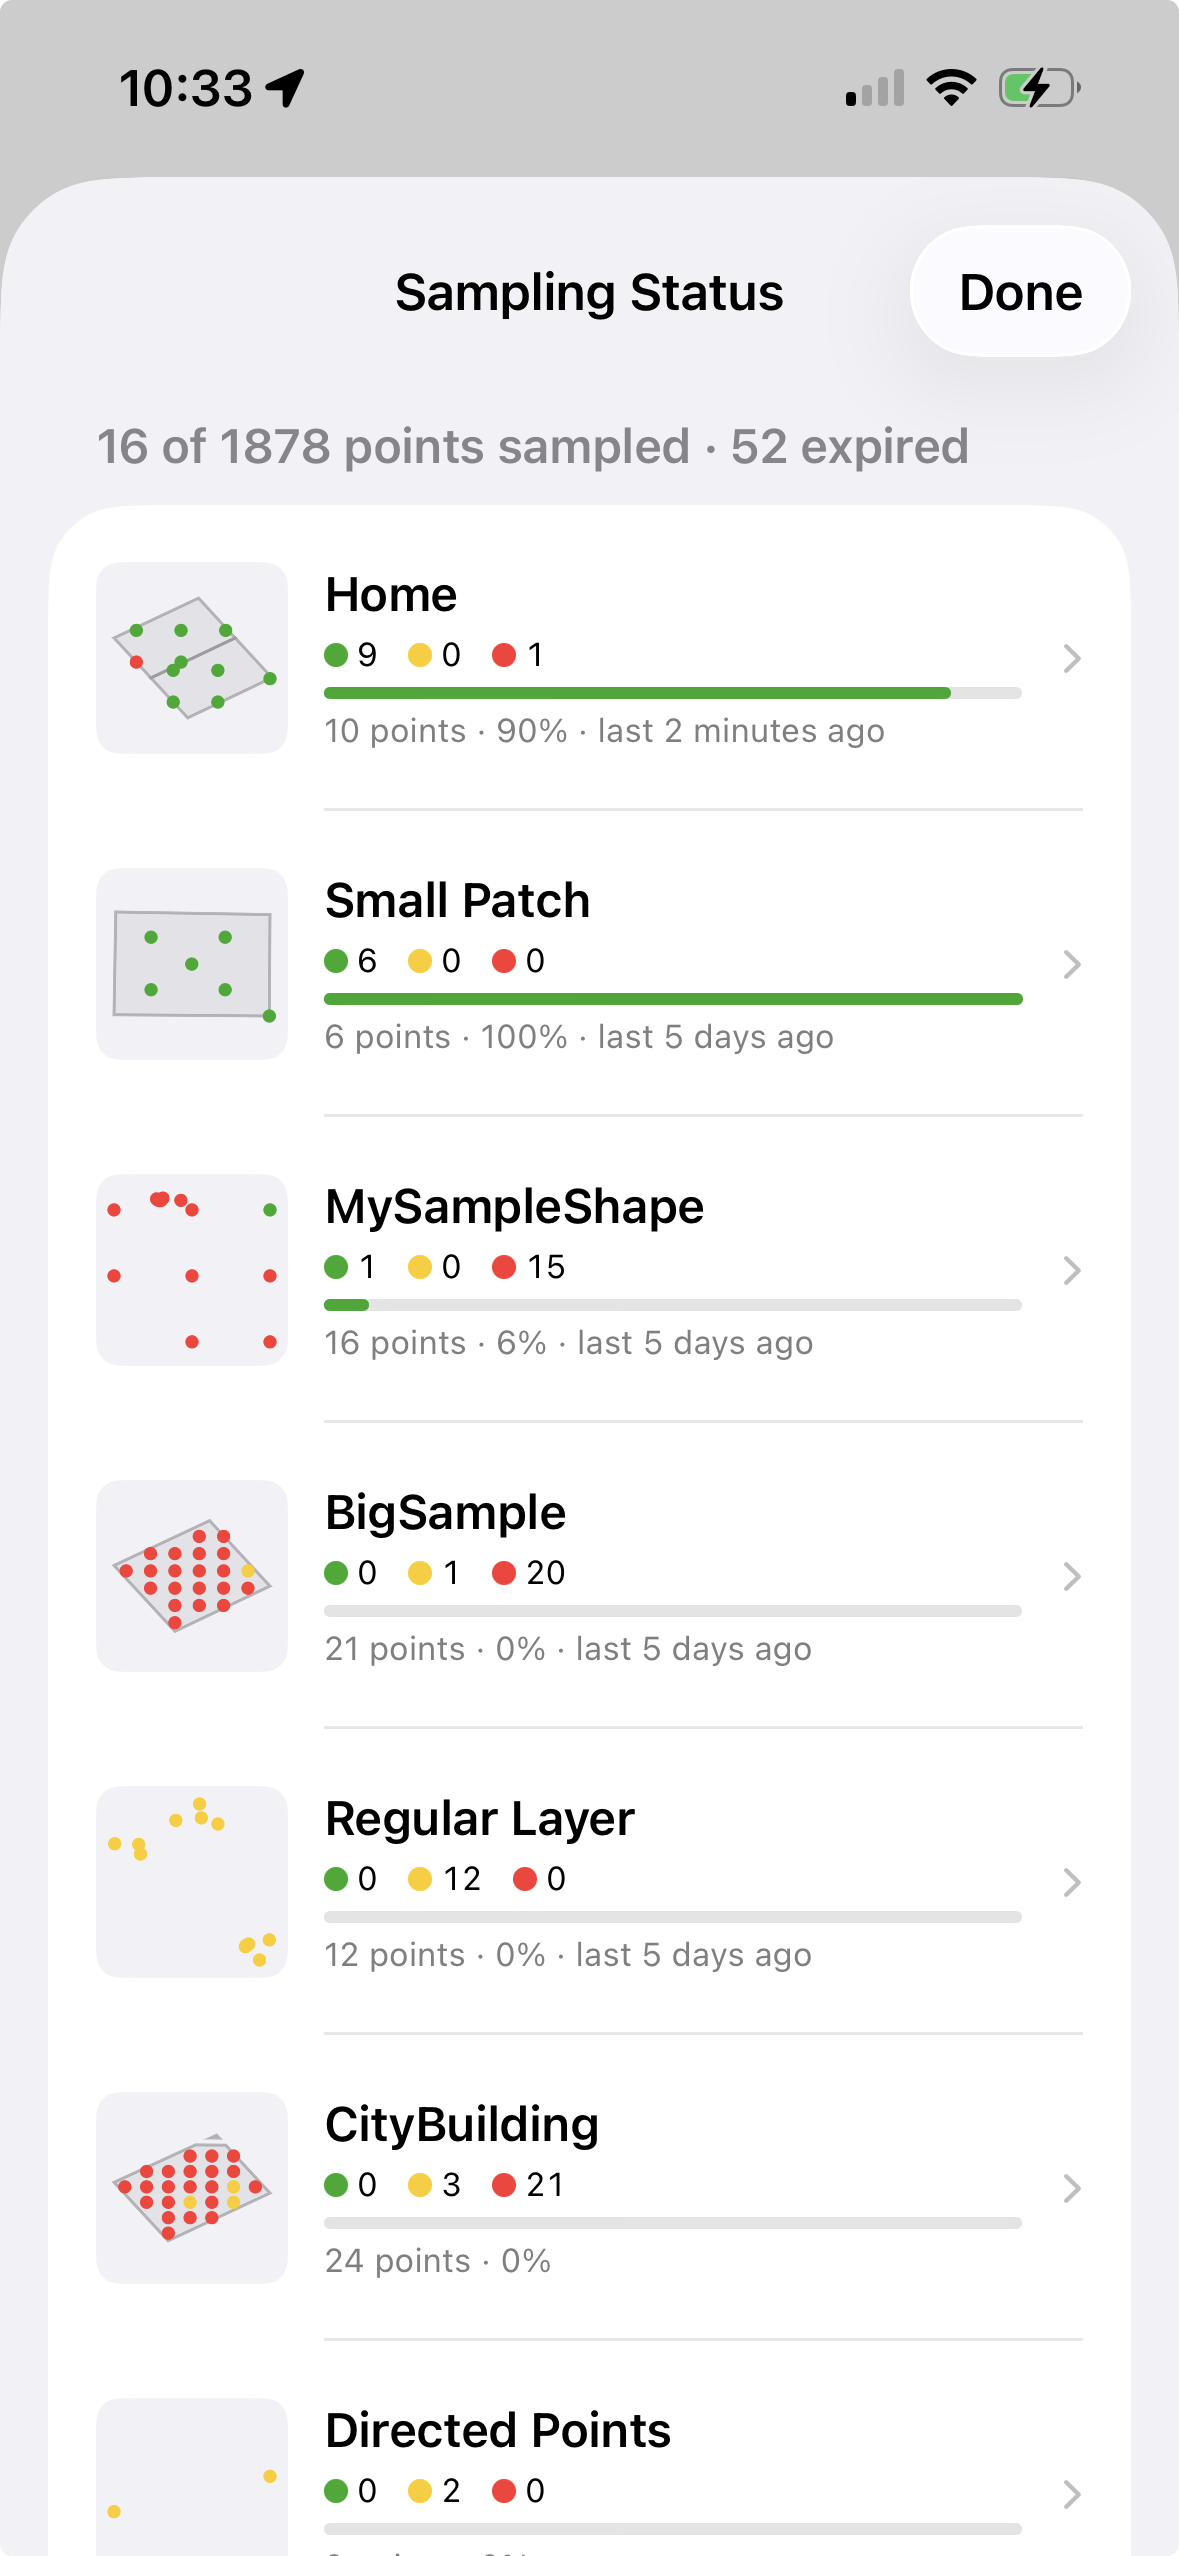
8. Monitor the Whole Program with the Sampling Status Panel
Across a dozen fields, you need more than colors on one map — you need the big picture. Open Tools › Sampling Status to see every sampling layer in one place. Each row shows how many points are sampled, expired, and not yet visited, the completion percentage, the date of the last collection, and a thumbnail of the grid and its field boundary. Tap a layer and GoGIS turns it on and zooms straight to it on the map.
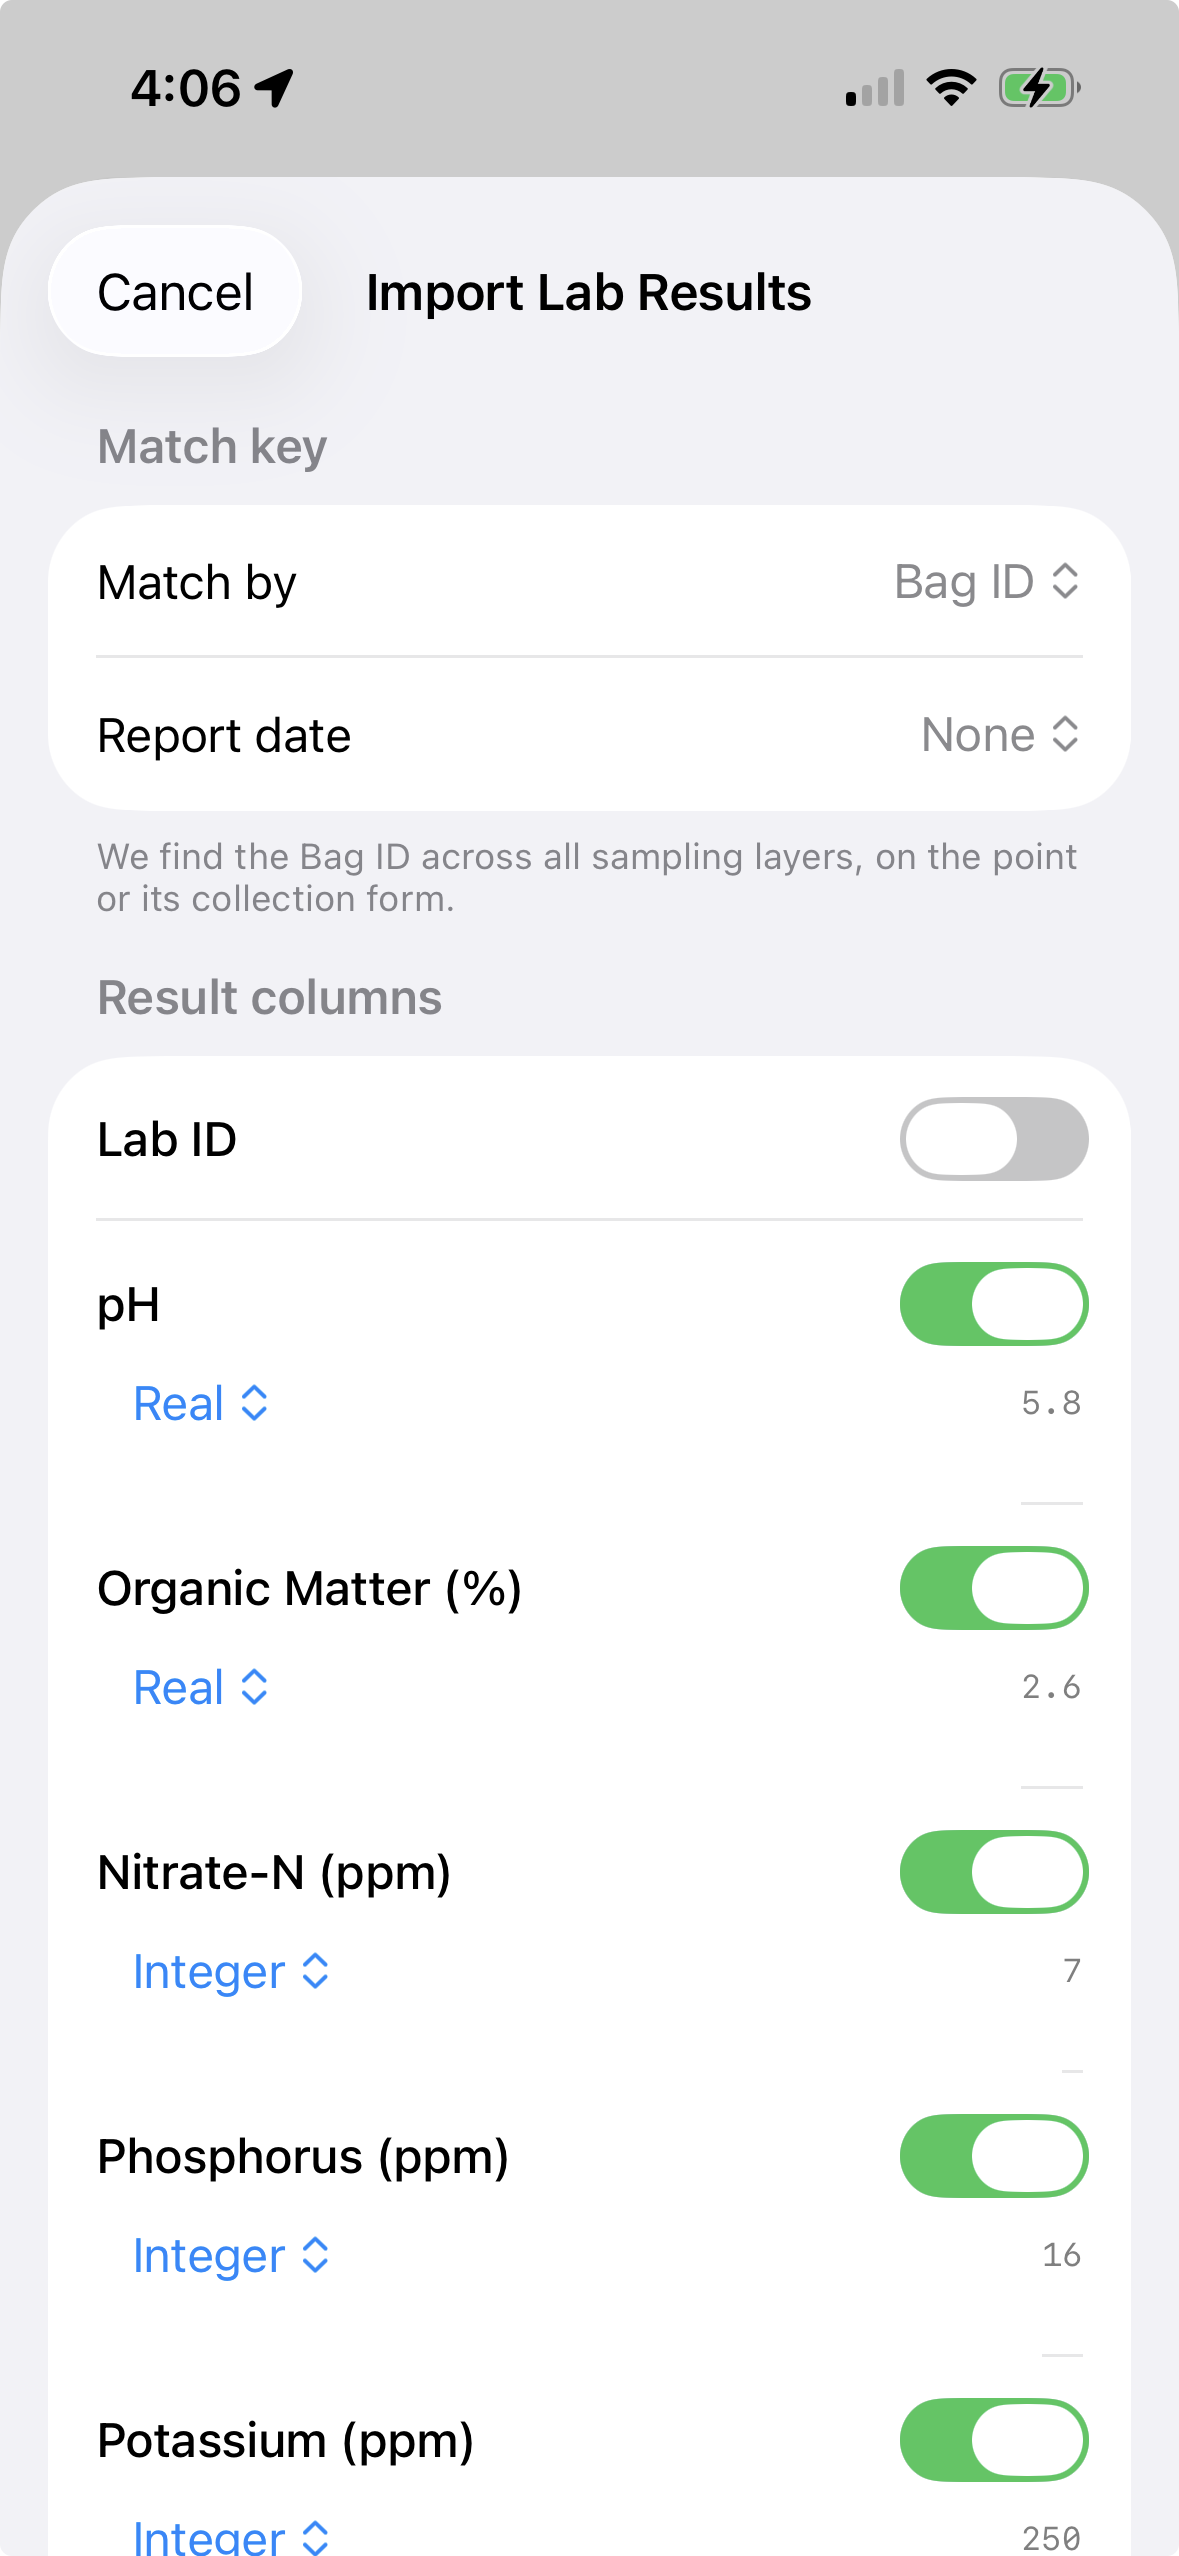
9. Import Your Lab Results
When the lab sends back your results, you don't re-type anything. Open Import Lab Results from the Sampling menu and pick the lab's CSV — or a ZIP of several. GoGIS matches each row to its sample point by Bag ID across every field, and files the values as a dated record on the point. Re-import next season and the new numbers stack up as history. The summary tells you exactly what matched, what didn't, and any duplicate IDs to fix.
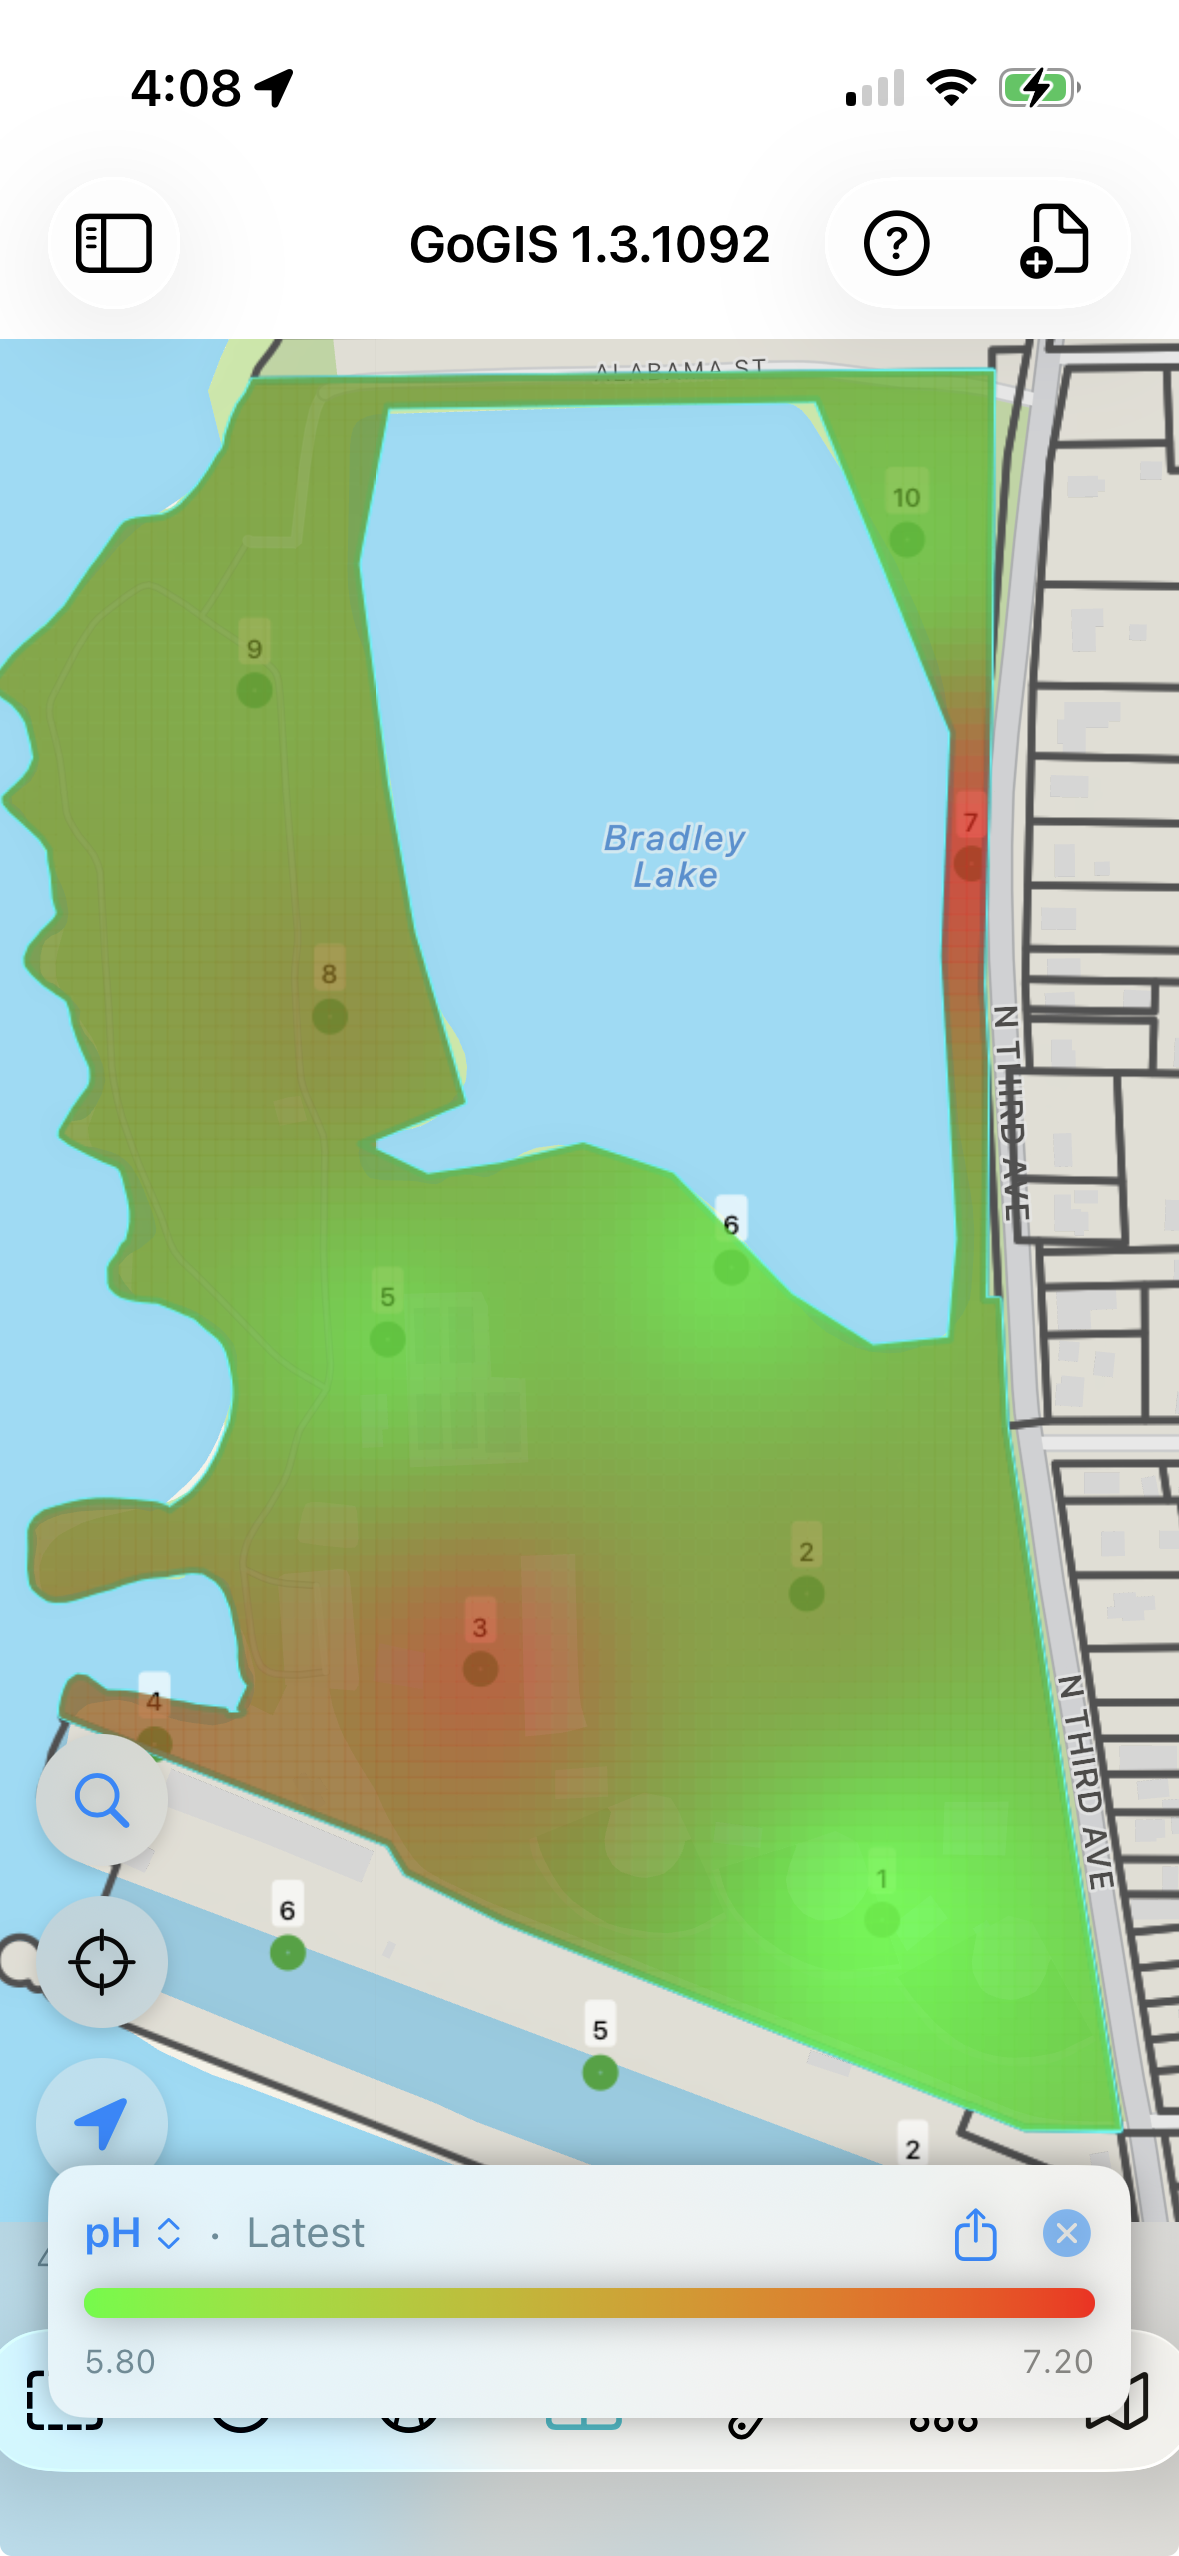
10. Map Results as Heat Maps
Now turn those numbers into a picture. Pick any result — pH, phosphorus, potassium, organic matter — and GoGIS interpolates a smooth color heat map clipped to your field boundary, right over the satellite image. Switch between chemicals from the legend, choose a smooth gradient or blocky management zones, and compare fields on one shared color scale. The same tool maps any point data with values — like yield, soil EC, or elevation.
11. Built-in Quality Control
Every sample point automatically records metadata you'd otherwise have to track manually:
- Parent ID — links each sample point back to the field polygon it belongs to
- Collection coordinates — records where you actually stood when you collected, not just where the grid point is
- Distance offset — shows how far you were from the target point, giving your agronomist or lab a quick quality-control check
Why distance matters: If a sample was collected 50 meters from the target point, that's worth knowing. Maybe there was a waterway in the way, maybe the GPS was drifting, maybe someone grabbed the wrong point. The distance field makes it easy to flag and review outliers.
12. Export and Share
When you're done, export the completed layer as a shapefile, GeoJSON, CSV, or KML — complete with all your attribute data, coordinates, sample numbers, and photos bundled in a ZIP. Related-form entries export alongside the layer, each carrying its sample number so repeat visits stay tied to the right point. Send it to your agronomist, upload it to your farm management platform, or open it in QGIS or ArcGIS for further analysis.
Hand Off a Report, Not Just Raw Data
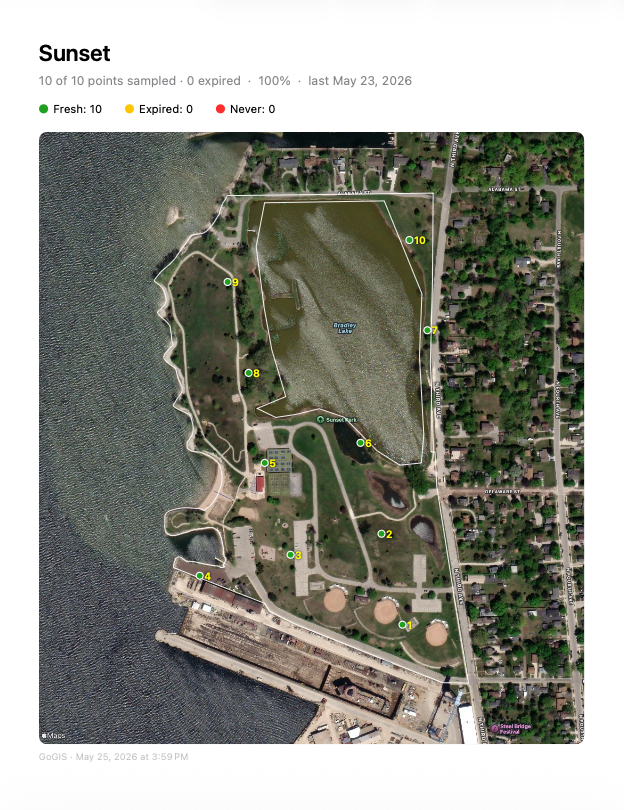
Raw shapefiles are great for the GIS desk, but the person paying for the work usually wants something they can actually read. From the Sampling Status panel you can export several field layers at once into a single ZIP — and each one comes with a ready-to-share PDF report alongside the data.
The report opens on a satellite map of the field with every sample point colored by status — green for fresh, amber for expired, red for never sampled — over the field boundary. Then comes a fast-scan grid of every point with its collection time, coordinates, and your form values, followed by detail pages with photo thumbnails. There's also a flat CSV of the collected data, so the numbers drop straight into a spreadsheet. Pick the layers, choose a format, and you've turned a season of fieldwork into a client-ready package in one step.
Once lab results are in, the report grows with them: a color heat-map page for every chemical joins the overview map and point detail pages, so the deliverable shows not just where you sampled but what the field actually measured.
See a real one: Download a sample soil report (PDF, 1.1 MB) generated entirely in GoGIS — overview map, per-chemical heat maps, and point detail pages.
Any Point Layer Can Become a Sampling Layer
You don't have to start from a generated grid. Already have a set of points — monitoring wells, established plots, prior-year locations imported from a shapefile? Turn on sampling for that layer and you get the same freshness colors, status tracking, and re-sampling workflow on points you didn't generate in the app. The grid tool is one way in, not the only one.
What You Don't Need Anymore
- A separate handheld GPS unit
- Paper forms and clipboards
- Manual transcription back at the office
- A separate barcode scanner
- A spreadsheet to track which fields are due for re-sampling
- Cell service — everything works offline
Works for More Than Soil
The same grid-based sampling workflow works for any field collection task where you need to visit points inside a boundary: environmental site assessments, vegetation surveys, contamination sampling, wetland delineations. Define your boundary, generate your grid, and collect your data.
Try it in your next field season
GoGIS is a one-time purchase for iPhone and iPad. No subscription, no account required, and your data never leaves your device.
Get GoGIS on the App Store