Getting Started with Your Data
Step 1: Get Your Files Into GoGIS
GoGIS opens the most common spatial formats — shapefiles (.shp in a .zip), GeoJSON, KML, KMZ, GeoPackage (.gpkg), and CSV with coordinate columns. The process is the same for all of them.
Import into GoGIS
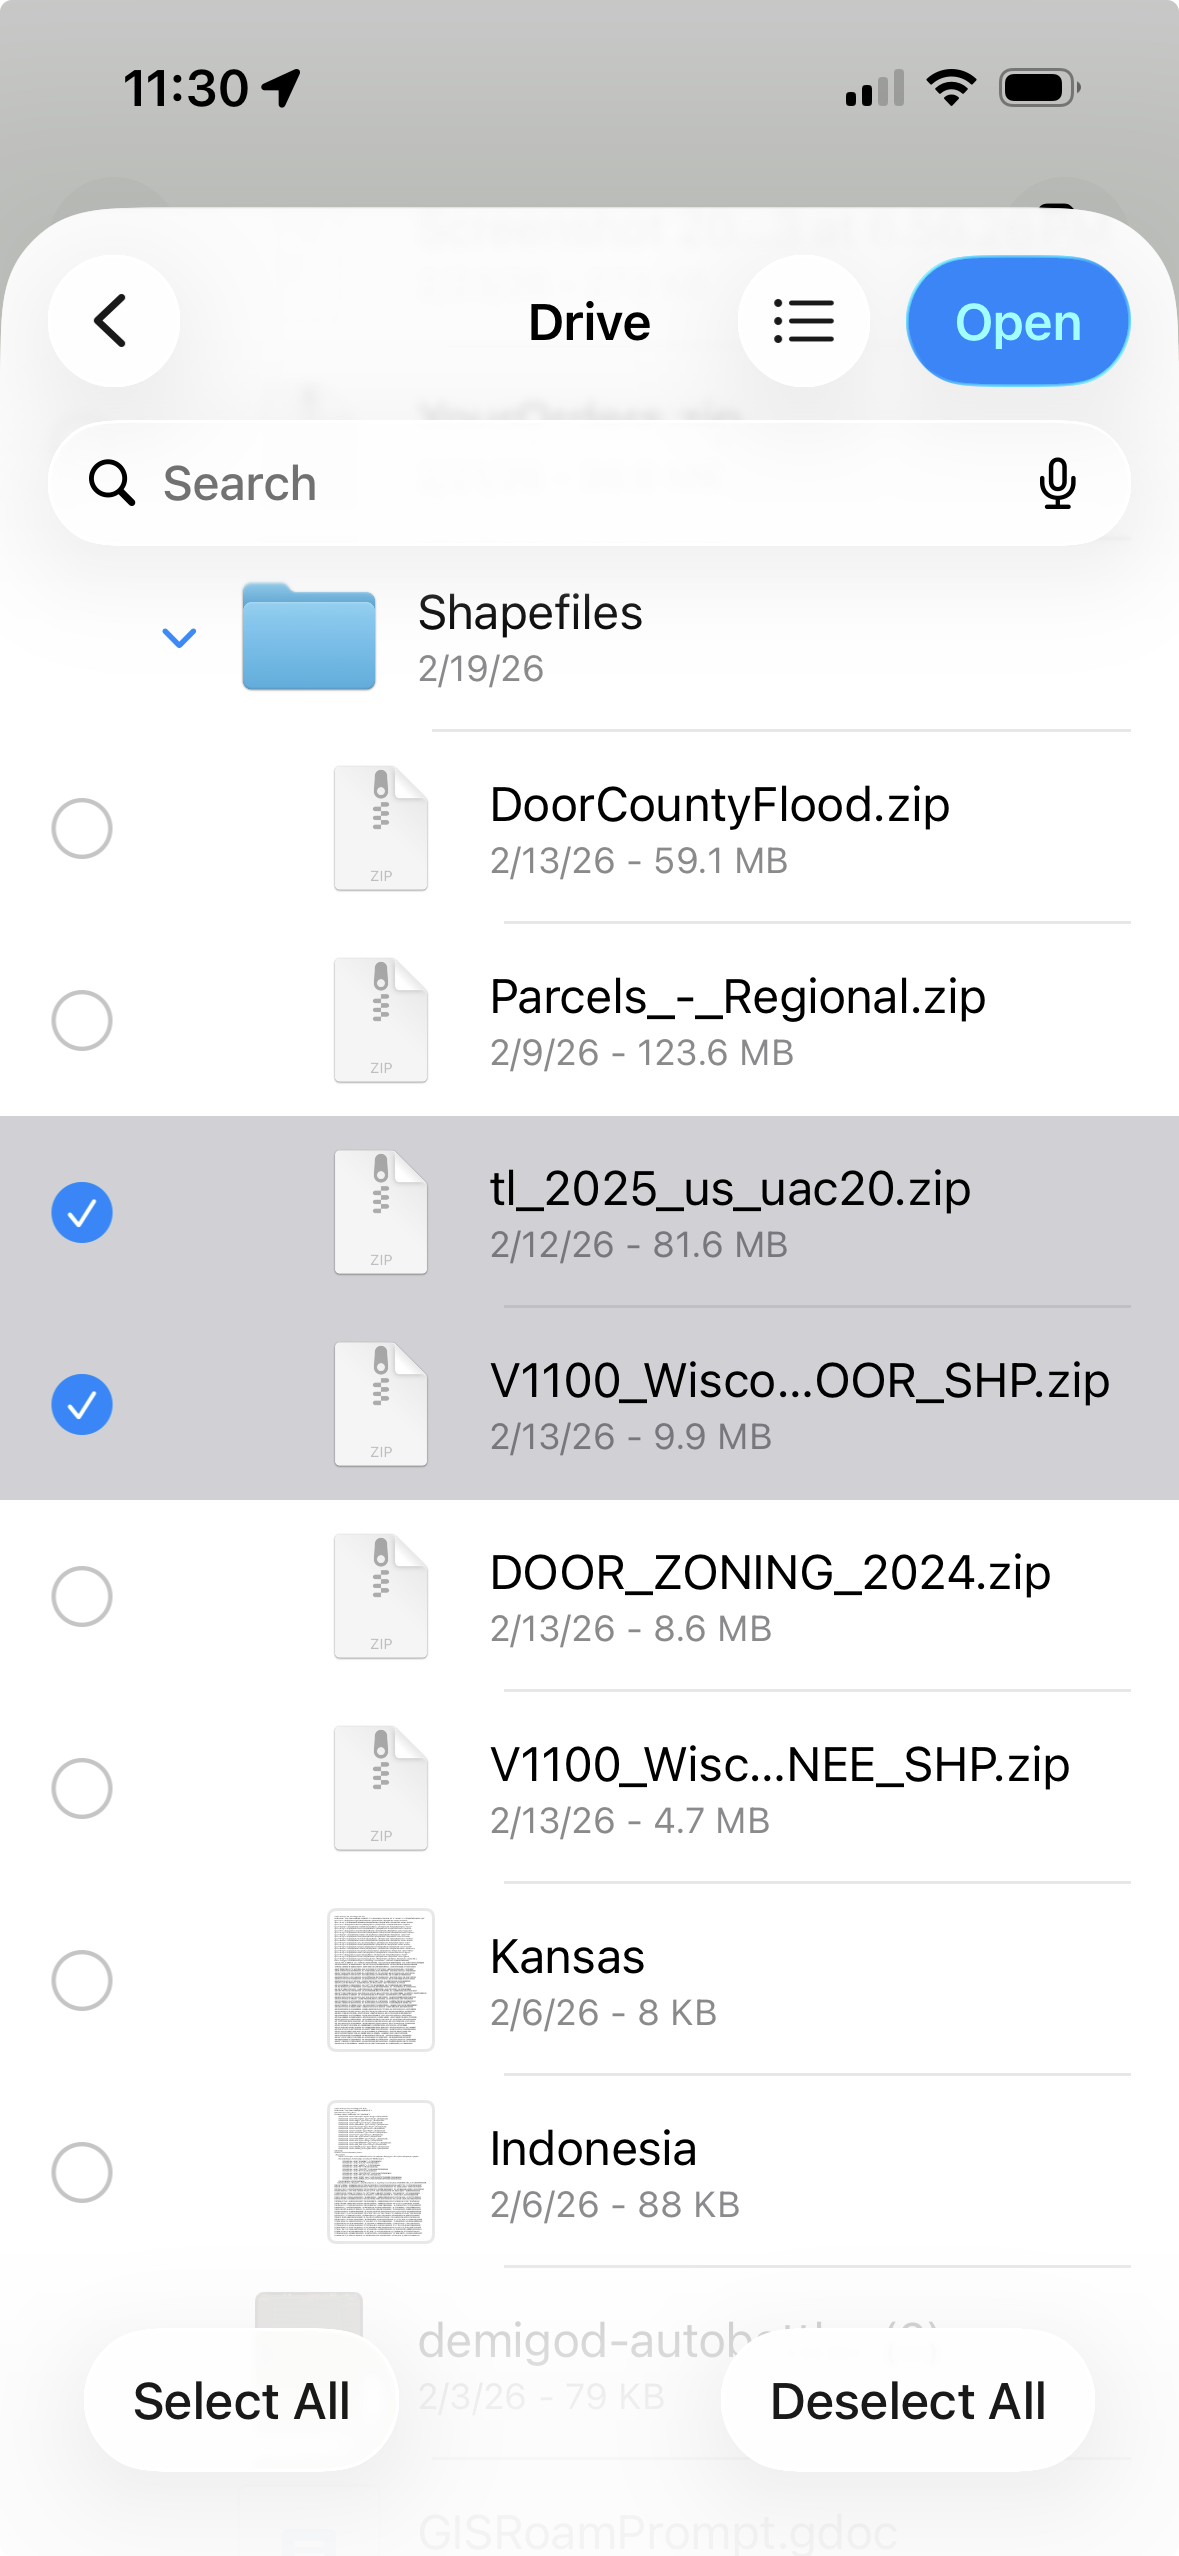
First, zip up your data files on your computer. For shapefiles, make sure the .shp, .shx, .dbf, and .prj are all in the same ZIP — GoGIS will unpack them automatically. For GeoJSON, KML, GeoPackage, and CSV, you can zip them or leave them as-is.
Then get the files to your iPhone or iPad and into GoGIS. You have a few options:
- iCloud Drive or Google Drive — drop the files into a folder on your cloud drive from your computer. They'll show up in the Files app on your phone. You can then either tap the file to open it directly in GoGIS, or use the Import button inside the app.
- Finder (Mac) or Apple Devices (PC) — plug in your phone, find GoGIS in the Finder sidebar (Mac) or in the Apple Devices app from the Microsoft Store (PC), and drag files directly into the app's document storage. Then use the Import button to bring them in.
- AirDrop — if you're on a Mac, right-click the file and AirDrop it to your phone. GoGIS will offer to open it automatically.
- Email — send the file to yourself and tap the attachment on your phone. GoGIS will offer to open it.
GoGIS handles the details: shapefiles are unzipped automatically, KMZ archives are extracted, GeoPackage files with multiple tables create one layer per table, and CSV files prompt you to pick which columns contain your coordinates.
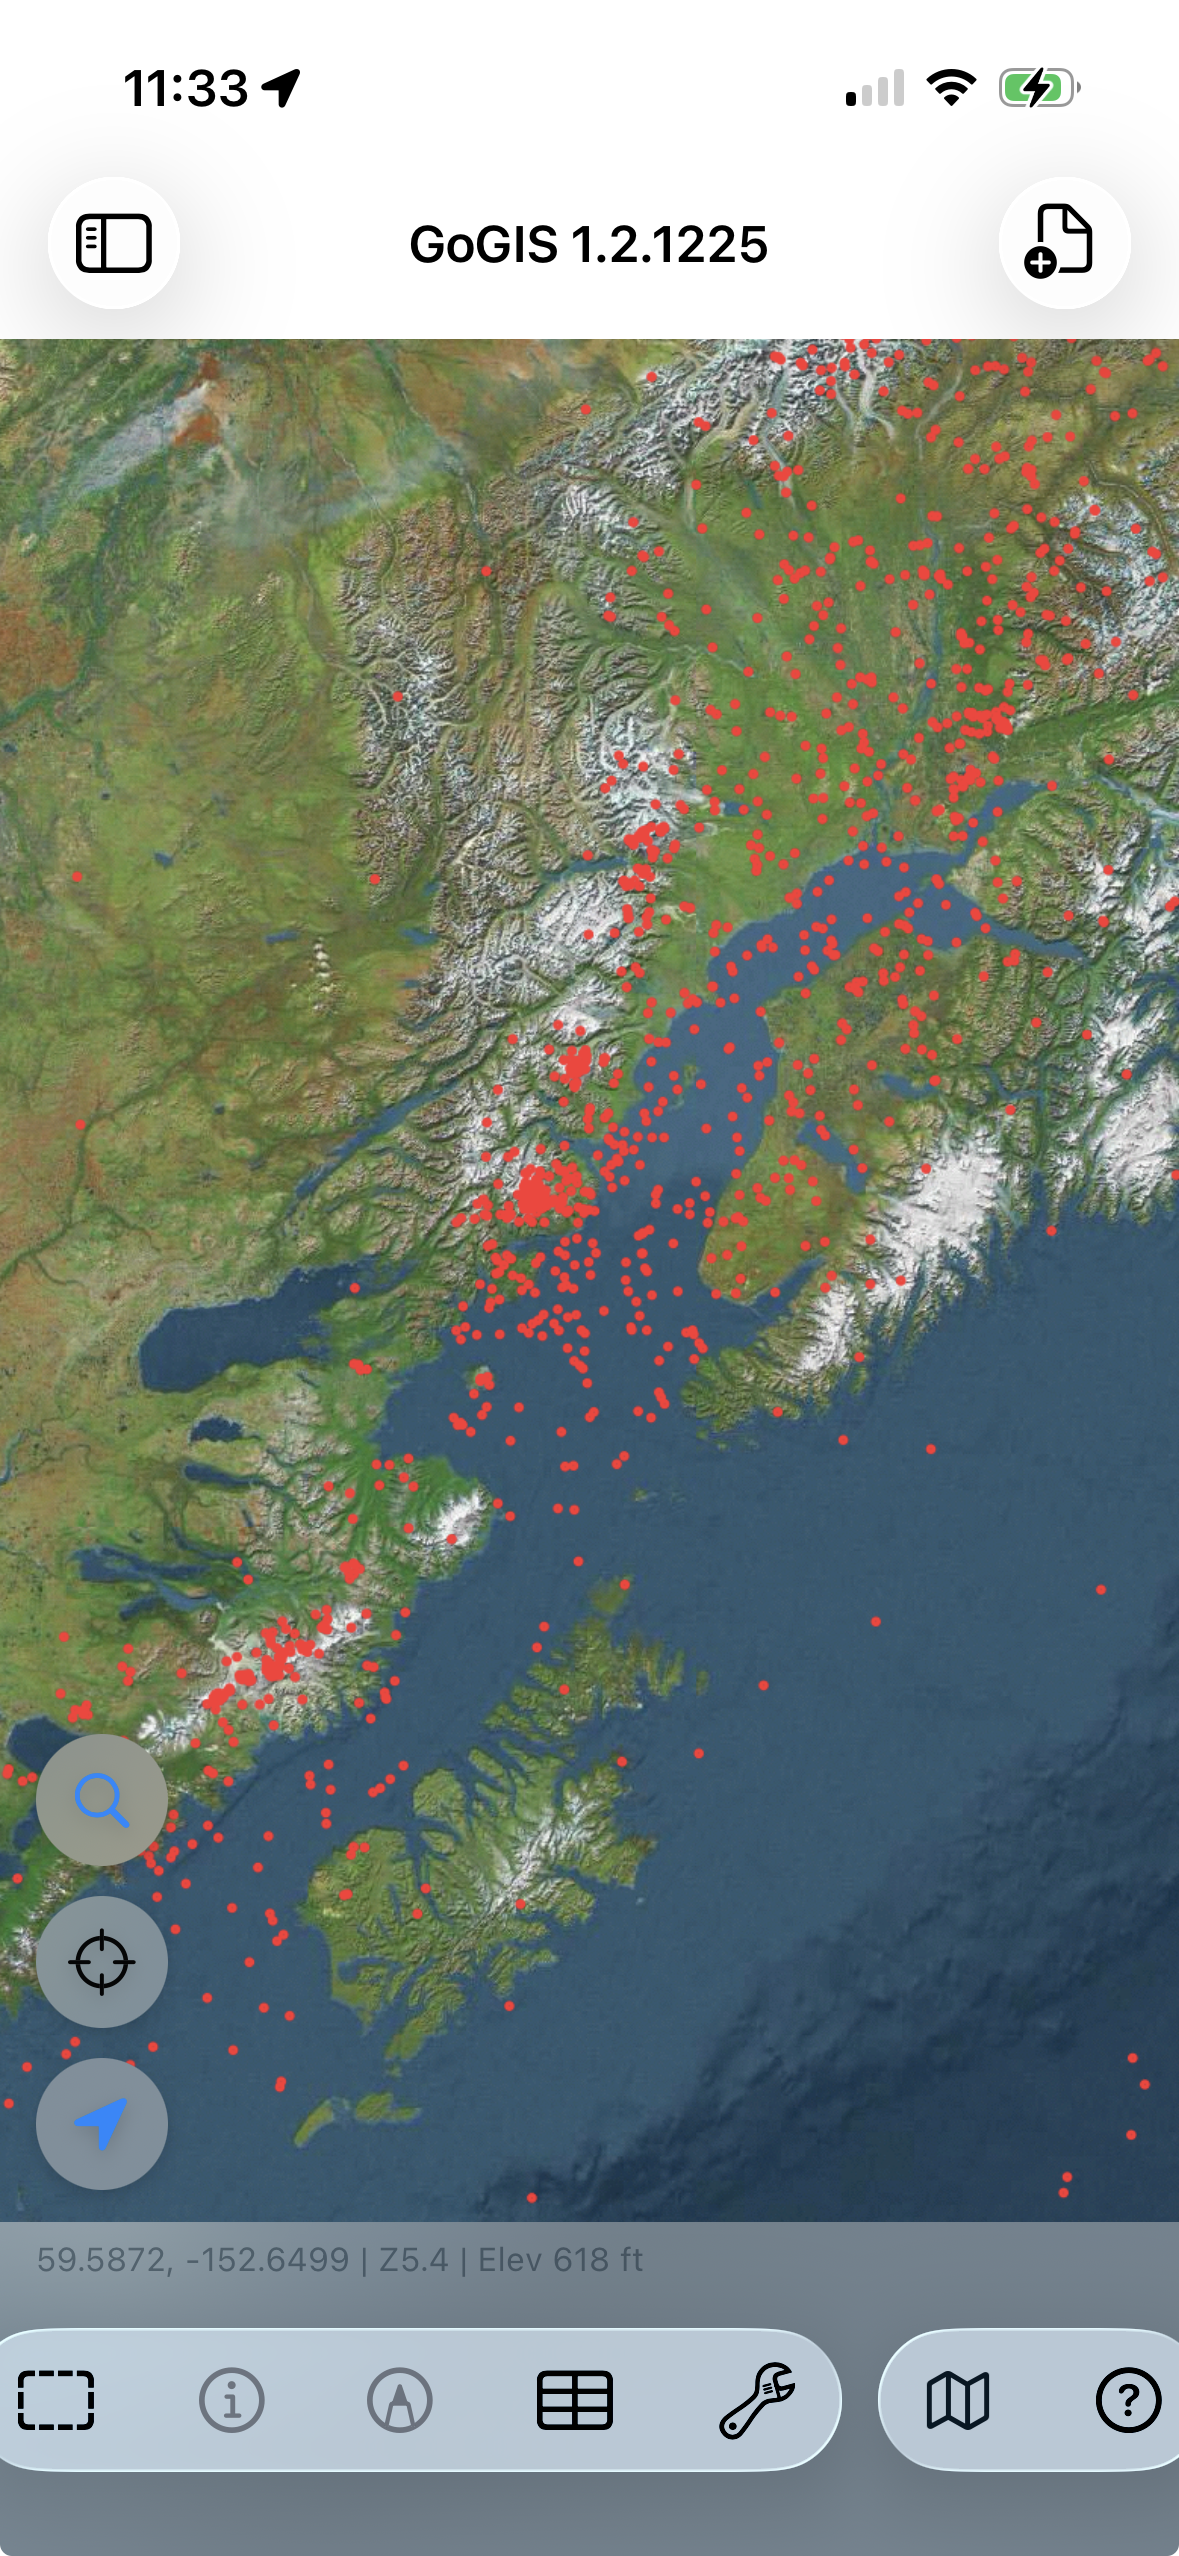
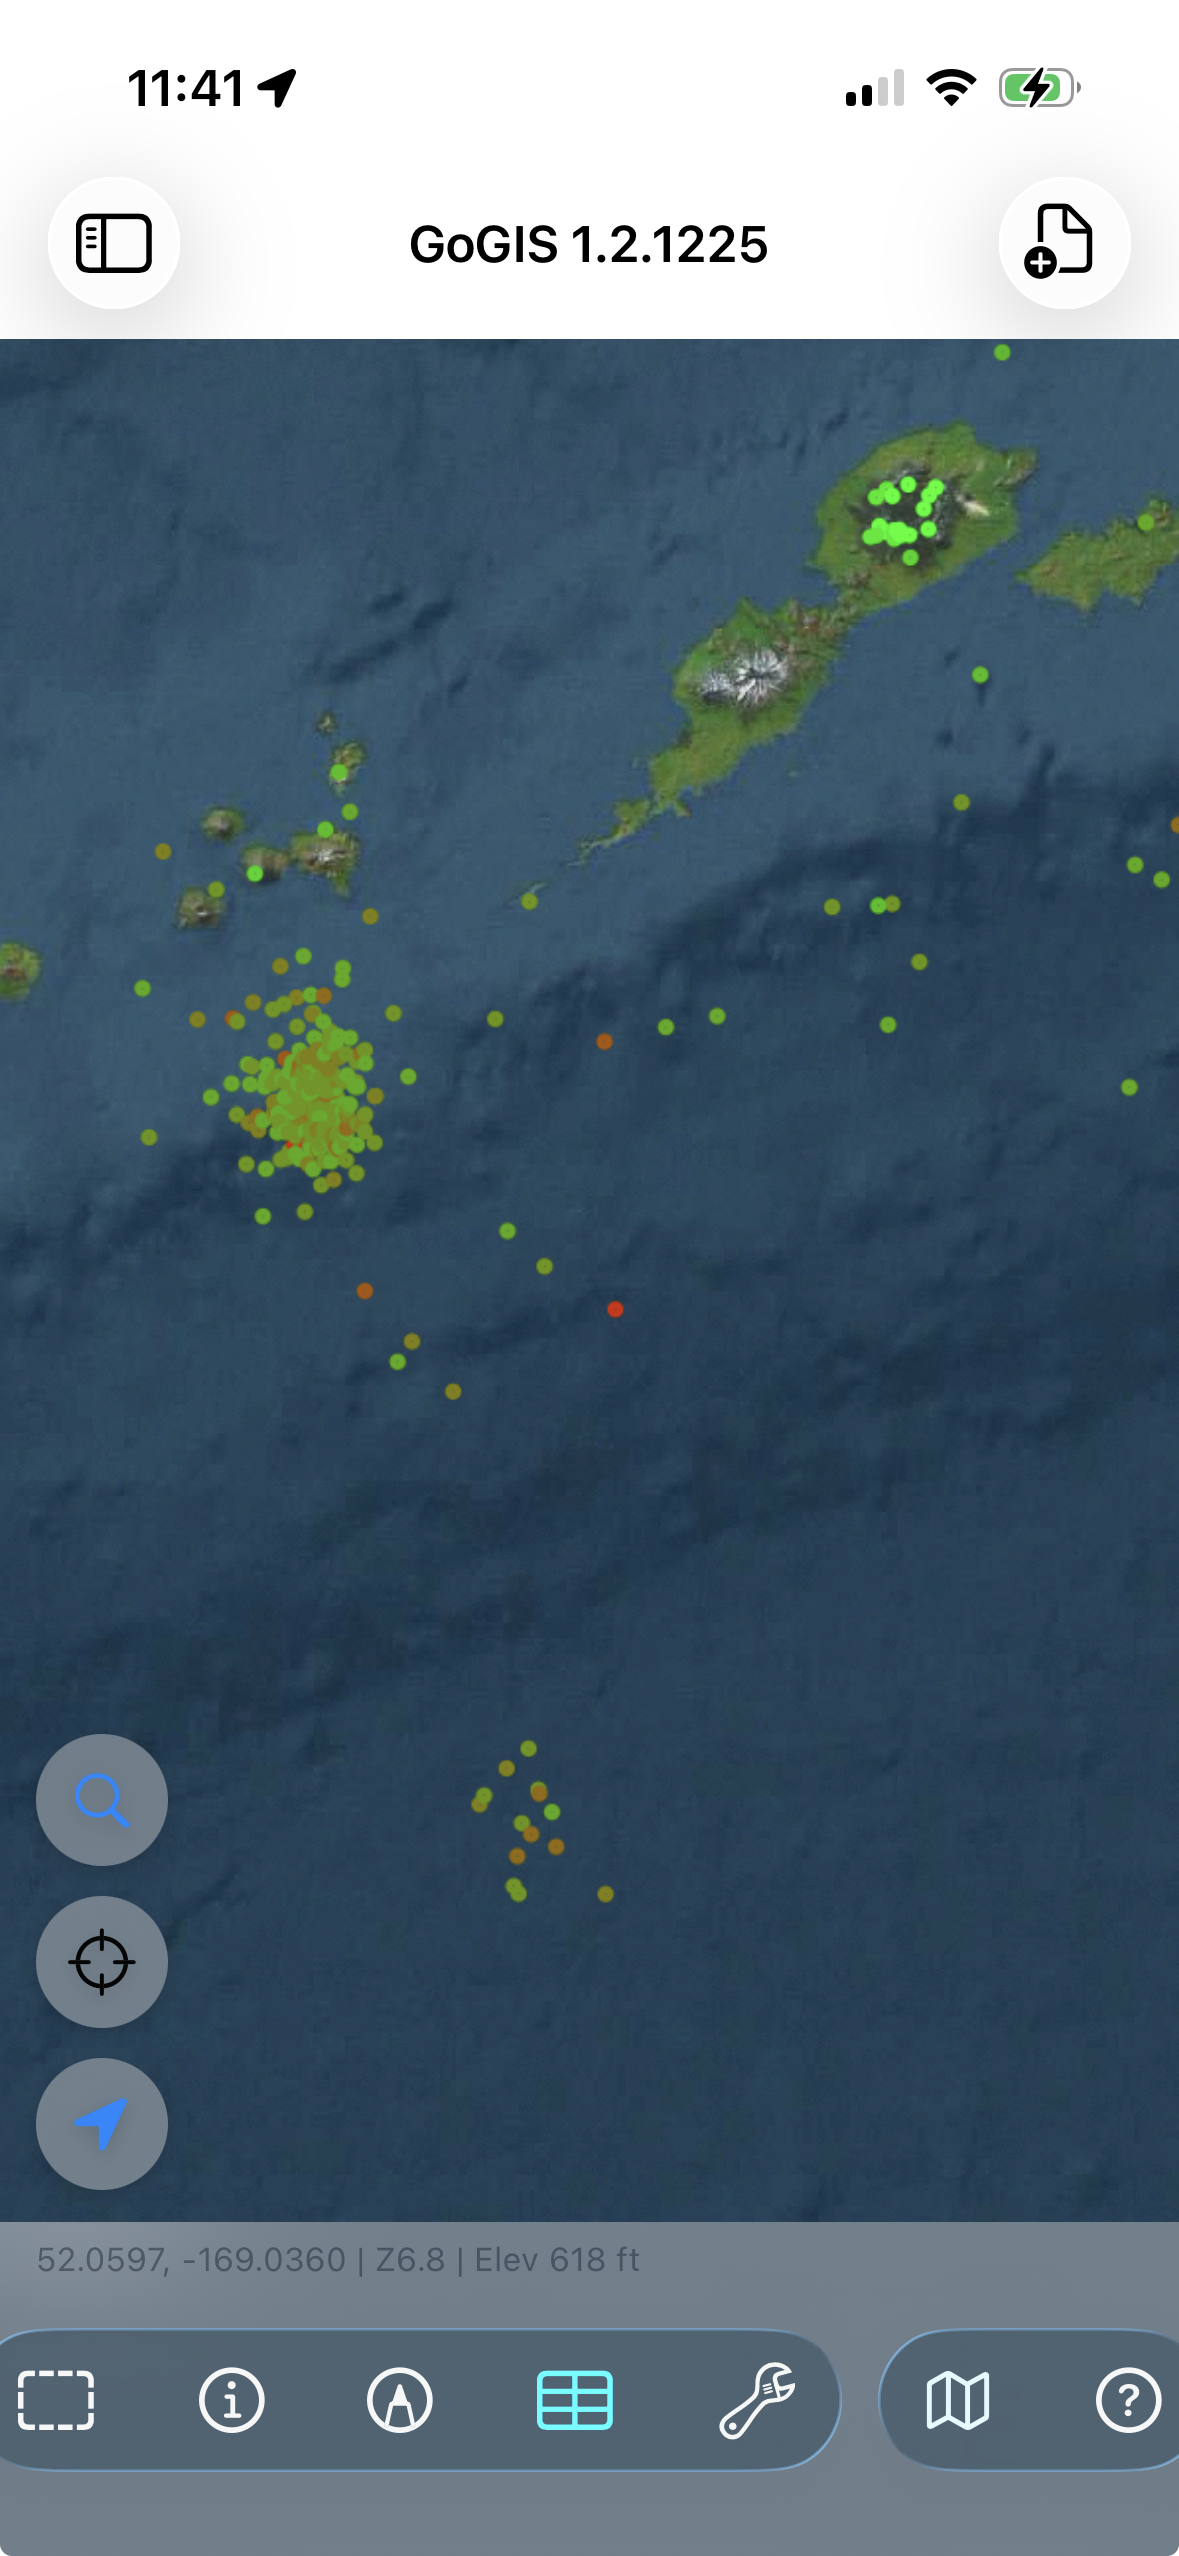
Step 2: Explore the Map
Once your file loads, you'll see your features on the map. Pinch to zoom, drag to pan. Your data is overlaid on Apple Maps for context.
The layers panel on the left shows every layer you've loaded. Tap the eye icon to toggle a layer on or off. Long-press to reorder. If you've loaded multiple files, they stack — flood zones under parcels under sample points, for example.
Your GPS location shows as a blue dot. Tap it to center the map on where you are. This is useful when you're in the field and want to see which parcel or zone you're standing in.
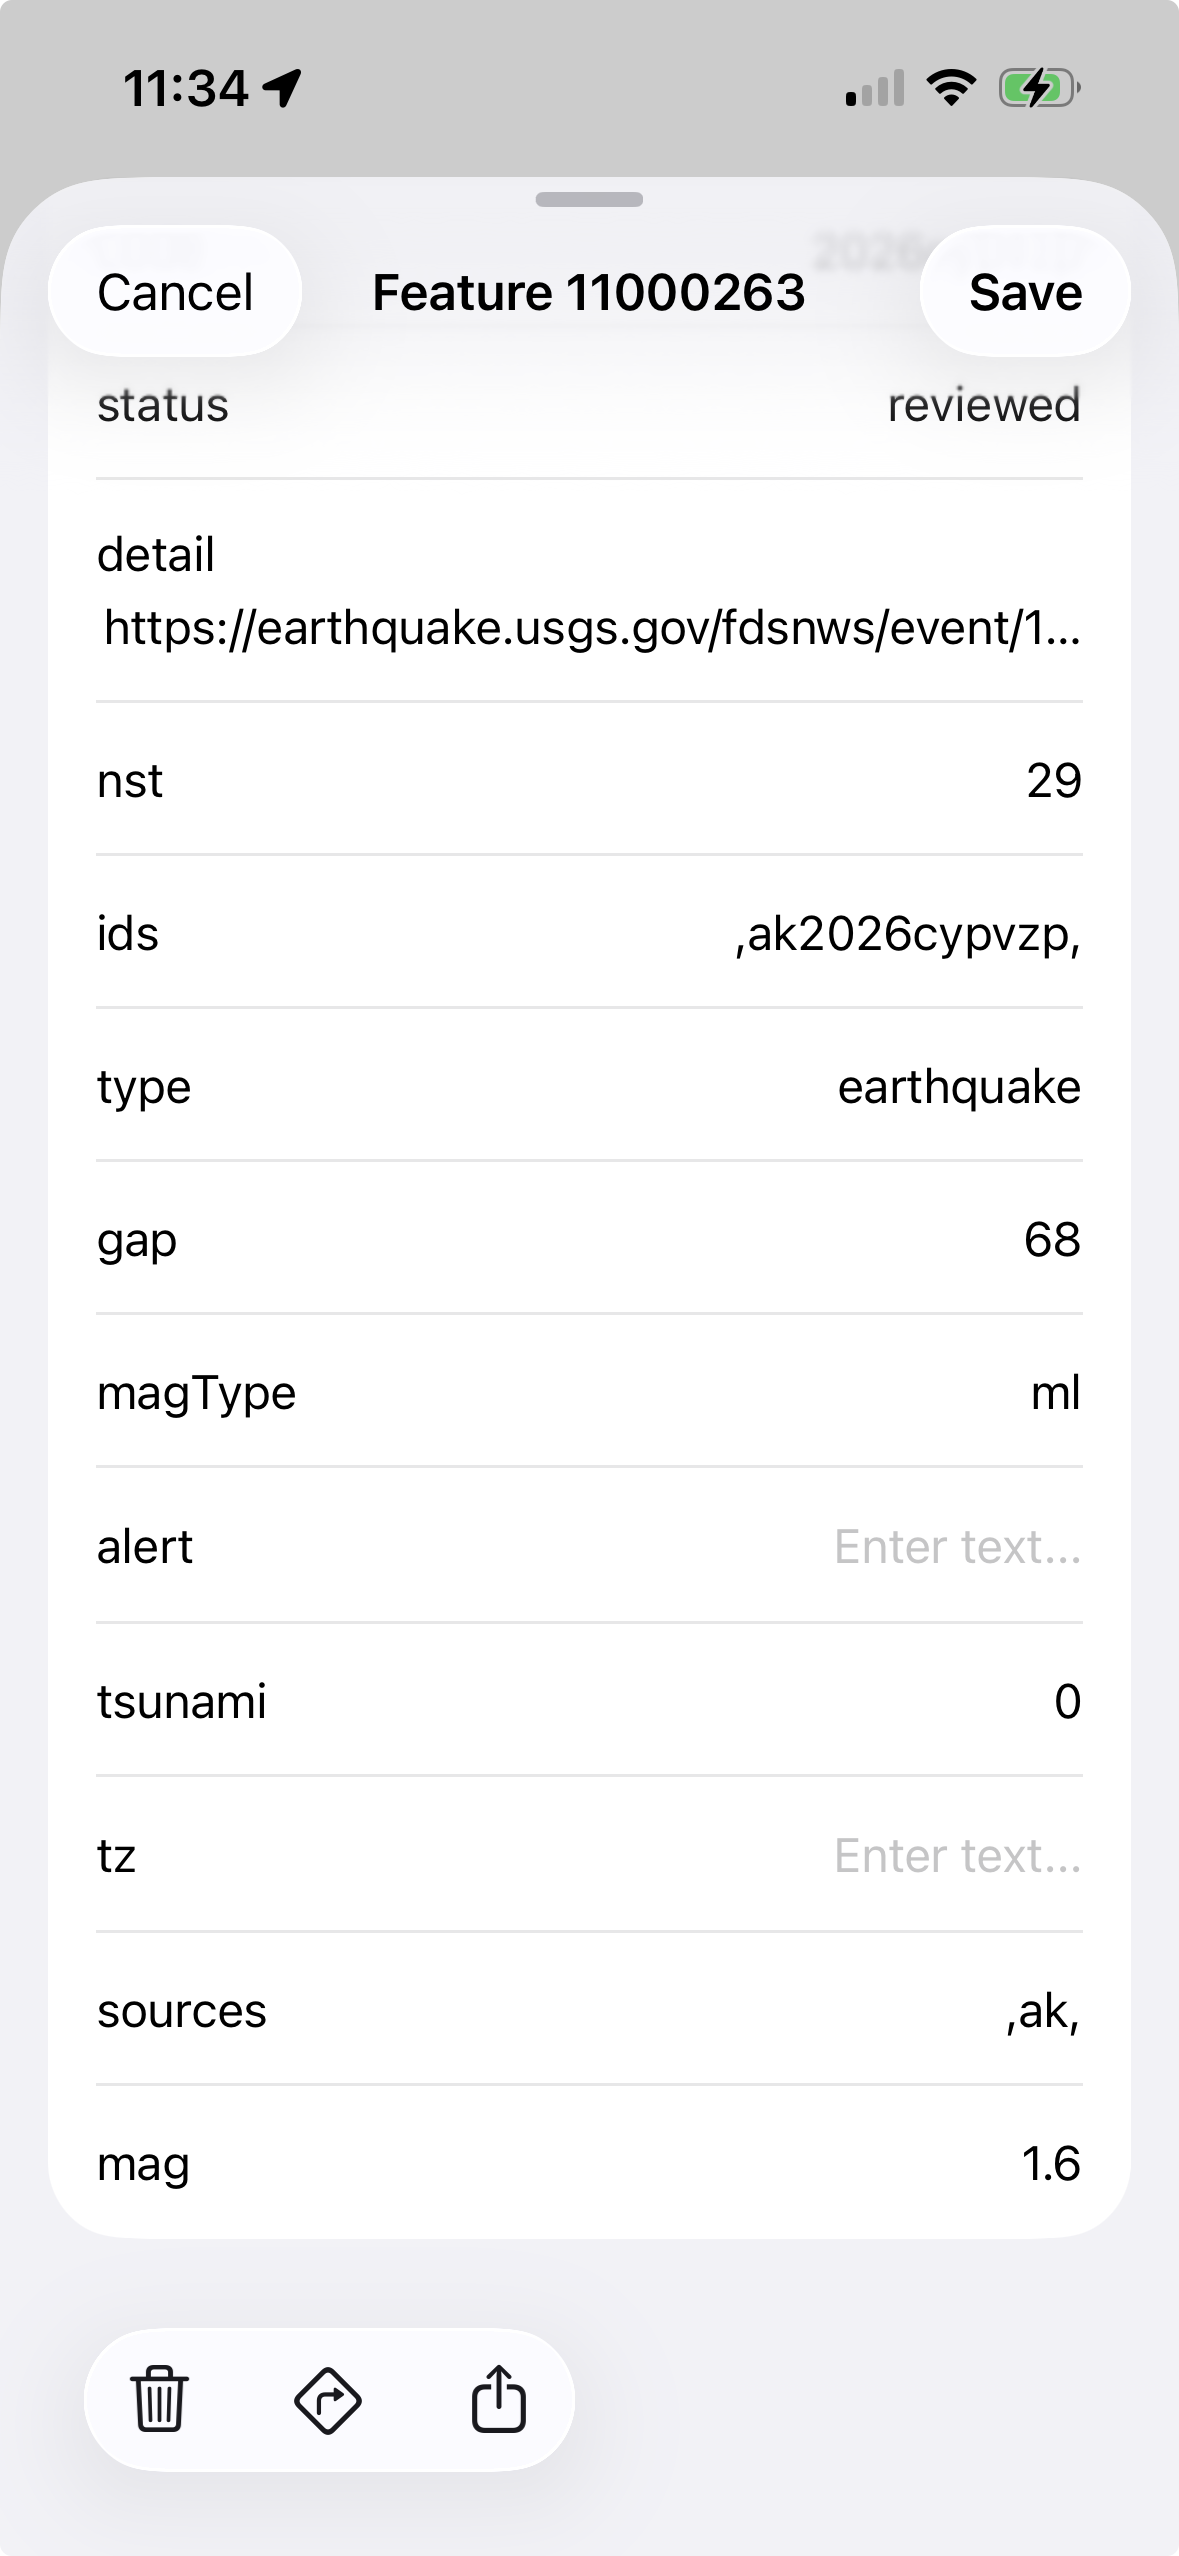
Step 3: Inspect a Feature
Tap any feature on the map — a parcel boundary, a point, a road segment — to see its attributes. A panel slides up showing every field and value stored in that feature: owner name, parcel ID, zone code, area, whatever your data contains.
This is the quickest way to answer "what is this thing?" when you're standing in front of it. No need to open a laptop, launch desktop GIS, and navigate to the right spot. Just tap.
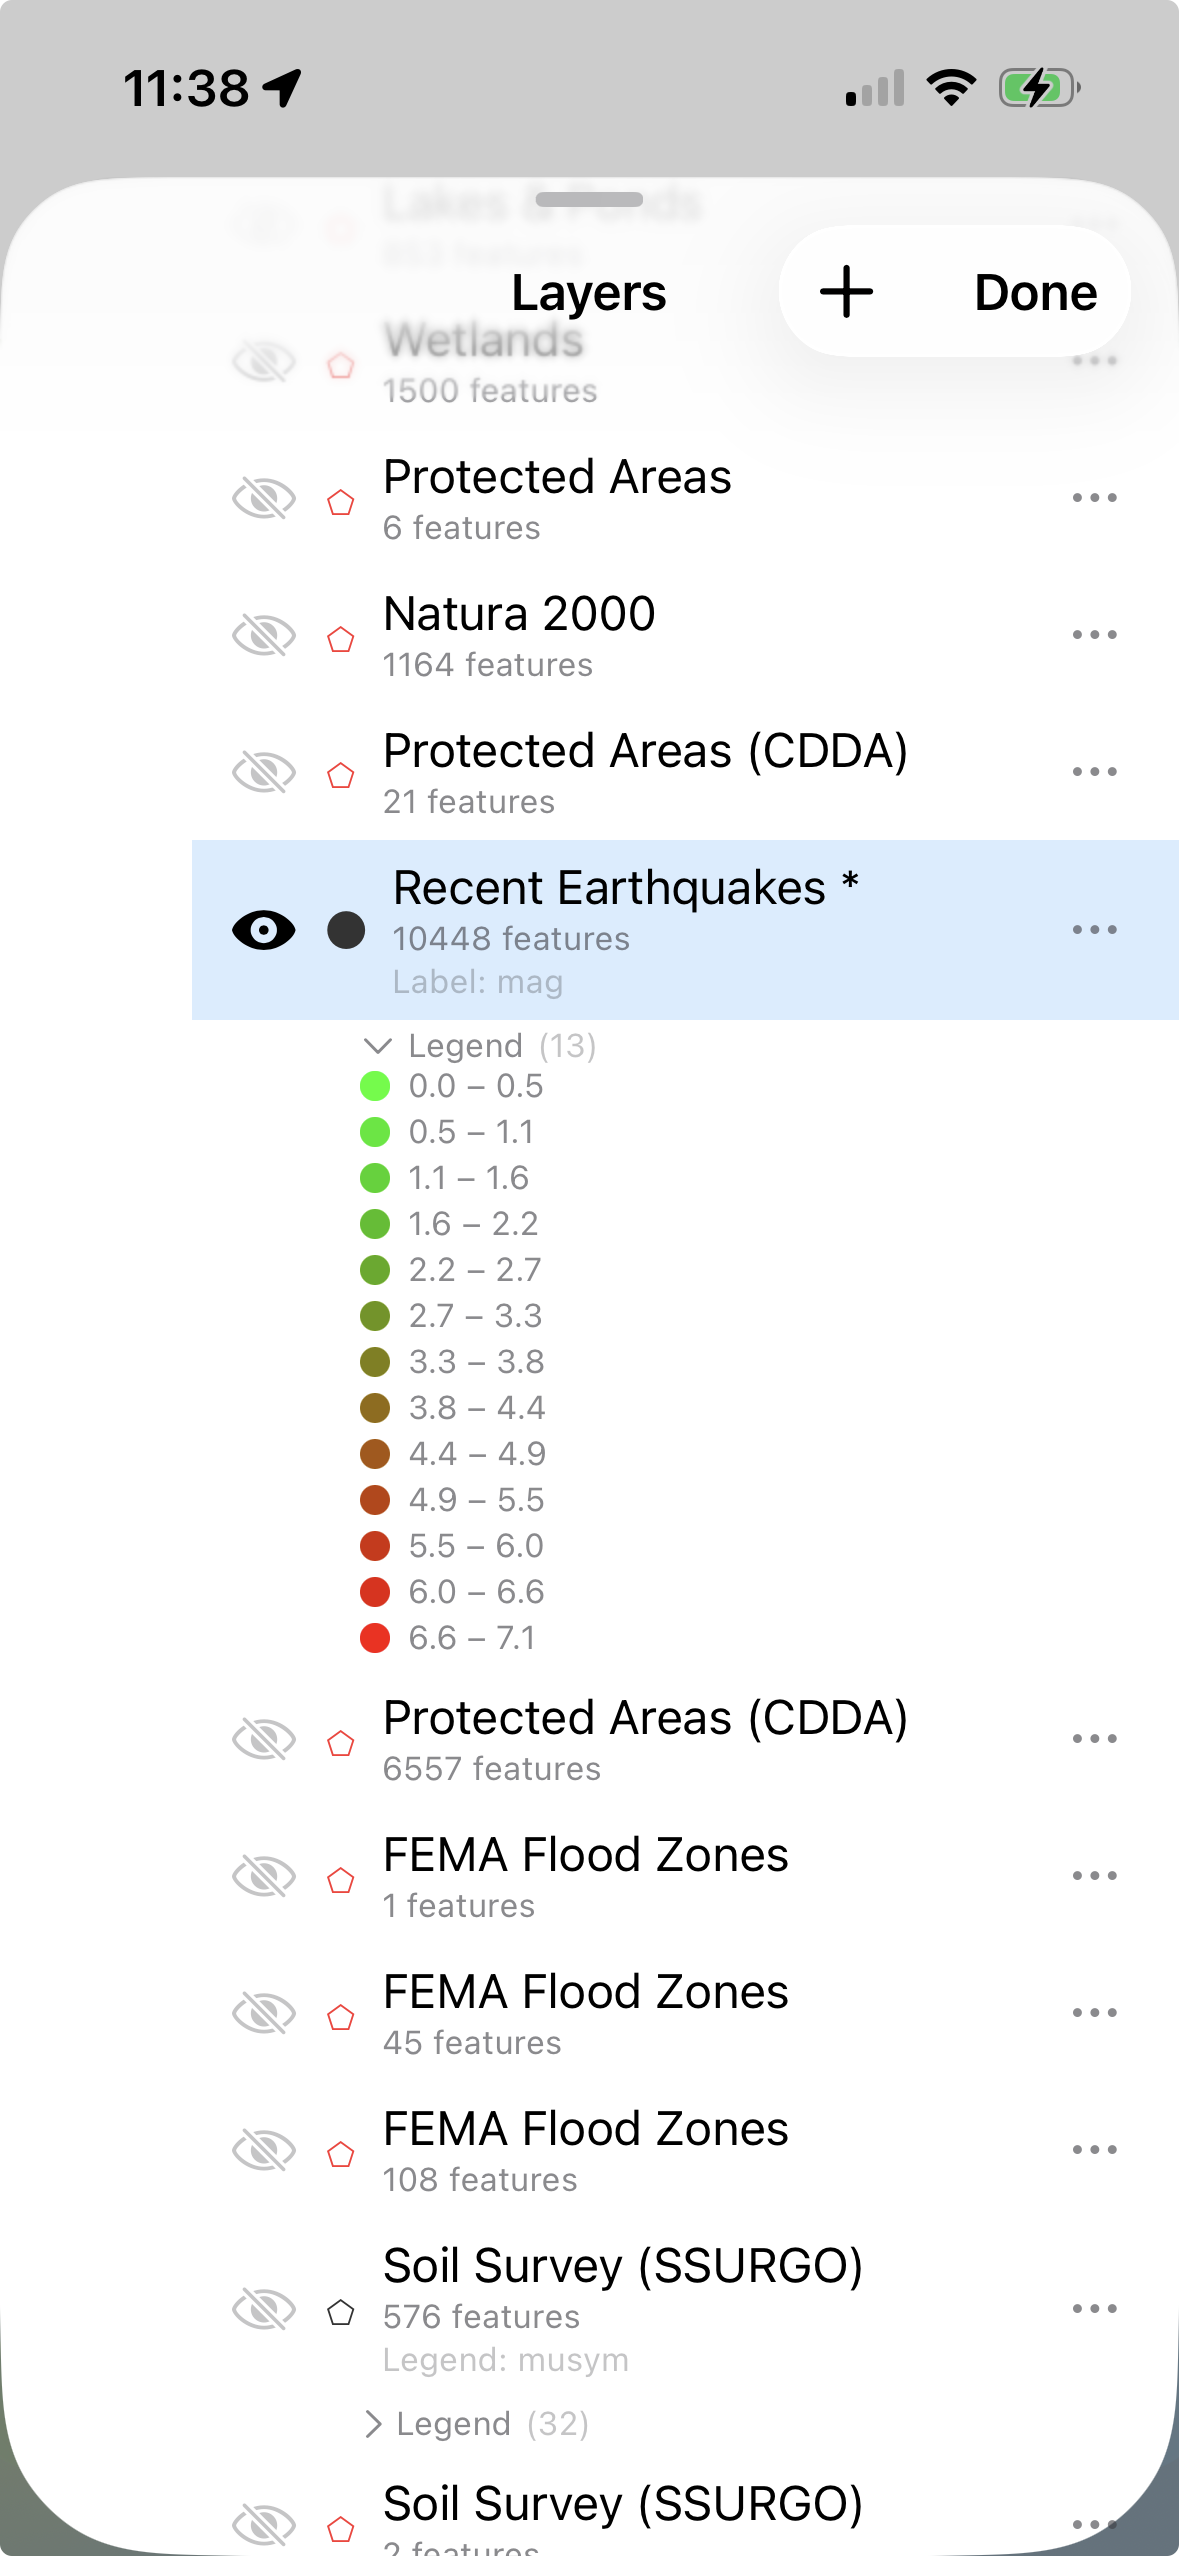
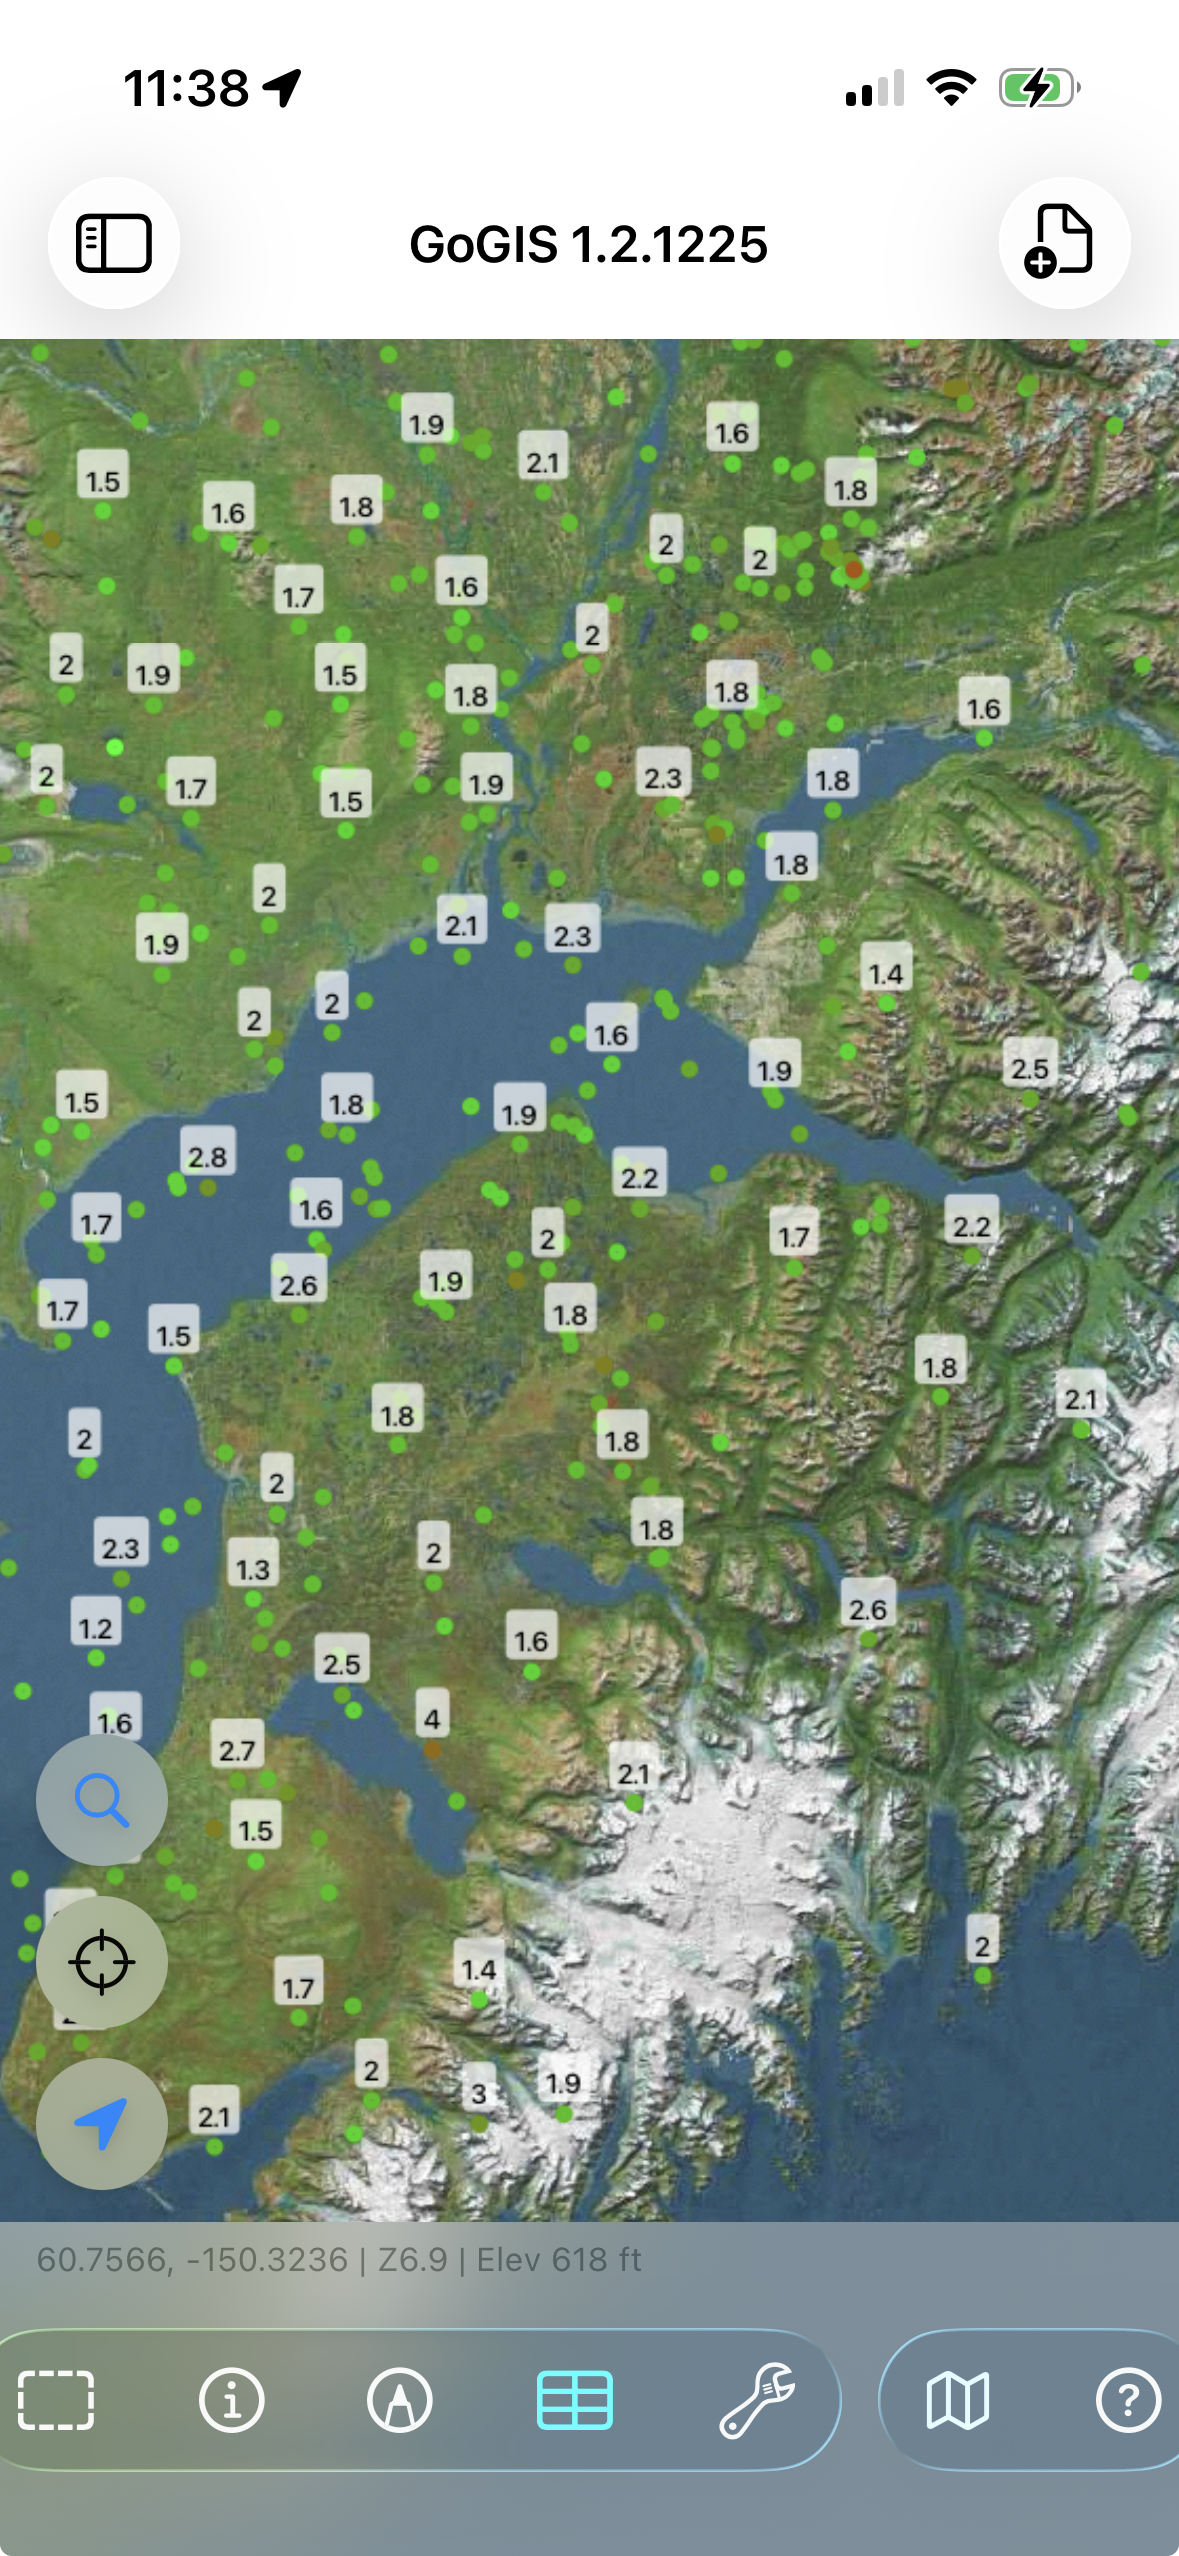
Step 4: Set Up a Legend
Raw data on a map is useful, but color-coded data tells a story. GoGIS lets you pick any attribute and automatically assign colors based on its values.
Open the layer settings and tap "Legend." Pick the attribute you want to visualize — land use code, soil type, pipe material, zone classification, whatever makes sense for your data. GoGIS reads the unique values and assigns a distinct color to each one. For numeric fields, it can create graduated ranges instead.
The result: you can see patterns at a glance. Agricultural parcels in green, commercial in blue, residential in yellow. Pipe conditions color-coded from good to critical. Field boundaries shaded by crop type.
Step 5: Add Labels
Sometimes you need to see a value on the map without tapping each feature. Set a display attribute and GoGIS renders it as a text label next to each feature — parcel IDs on property boundaries, street names along roads, sample numbers on collection points.
Open the layer settings and choose which attribute to display. Labels appear at appropriate zoom levels so the map doesn't get cluttered when you're zoomed out, but the detail is there when you zoom in.
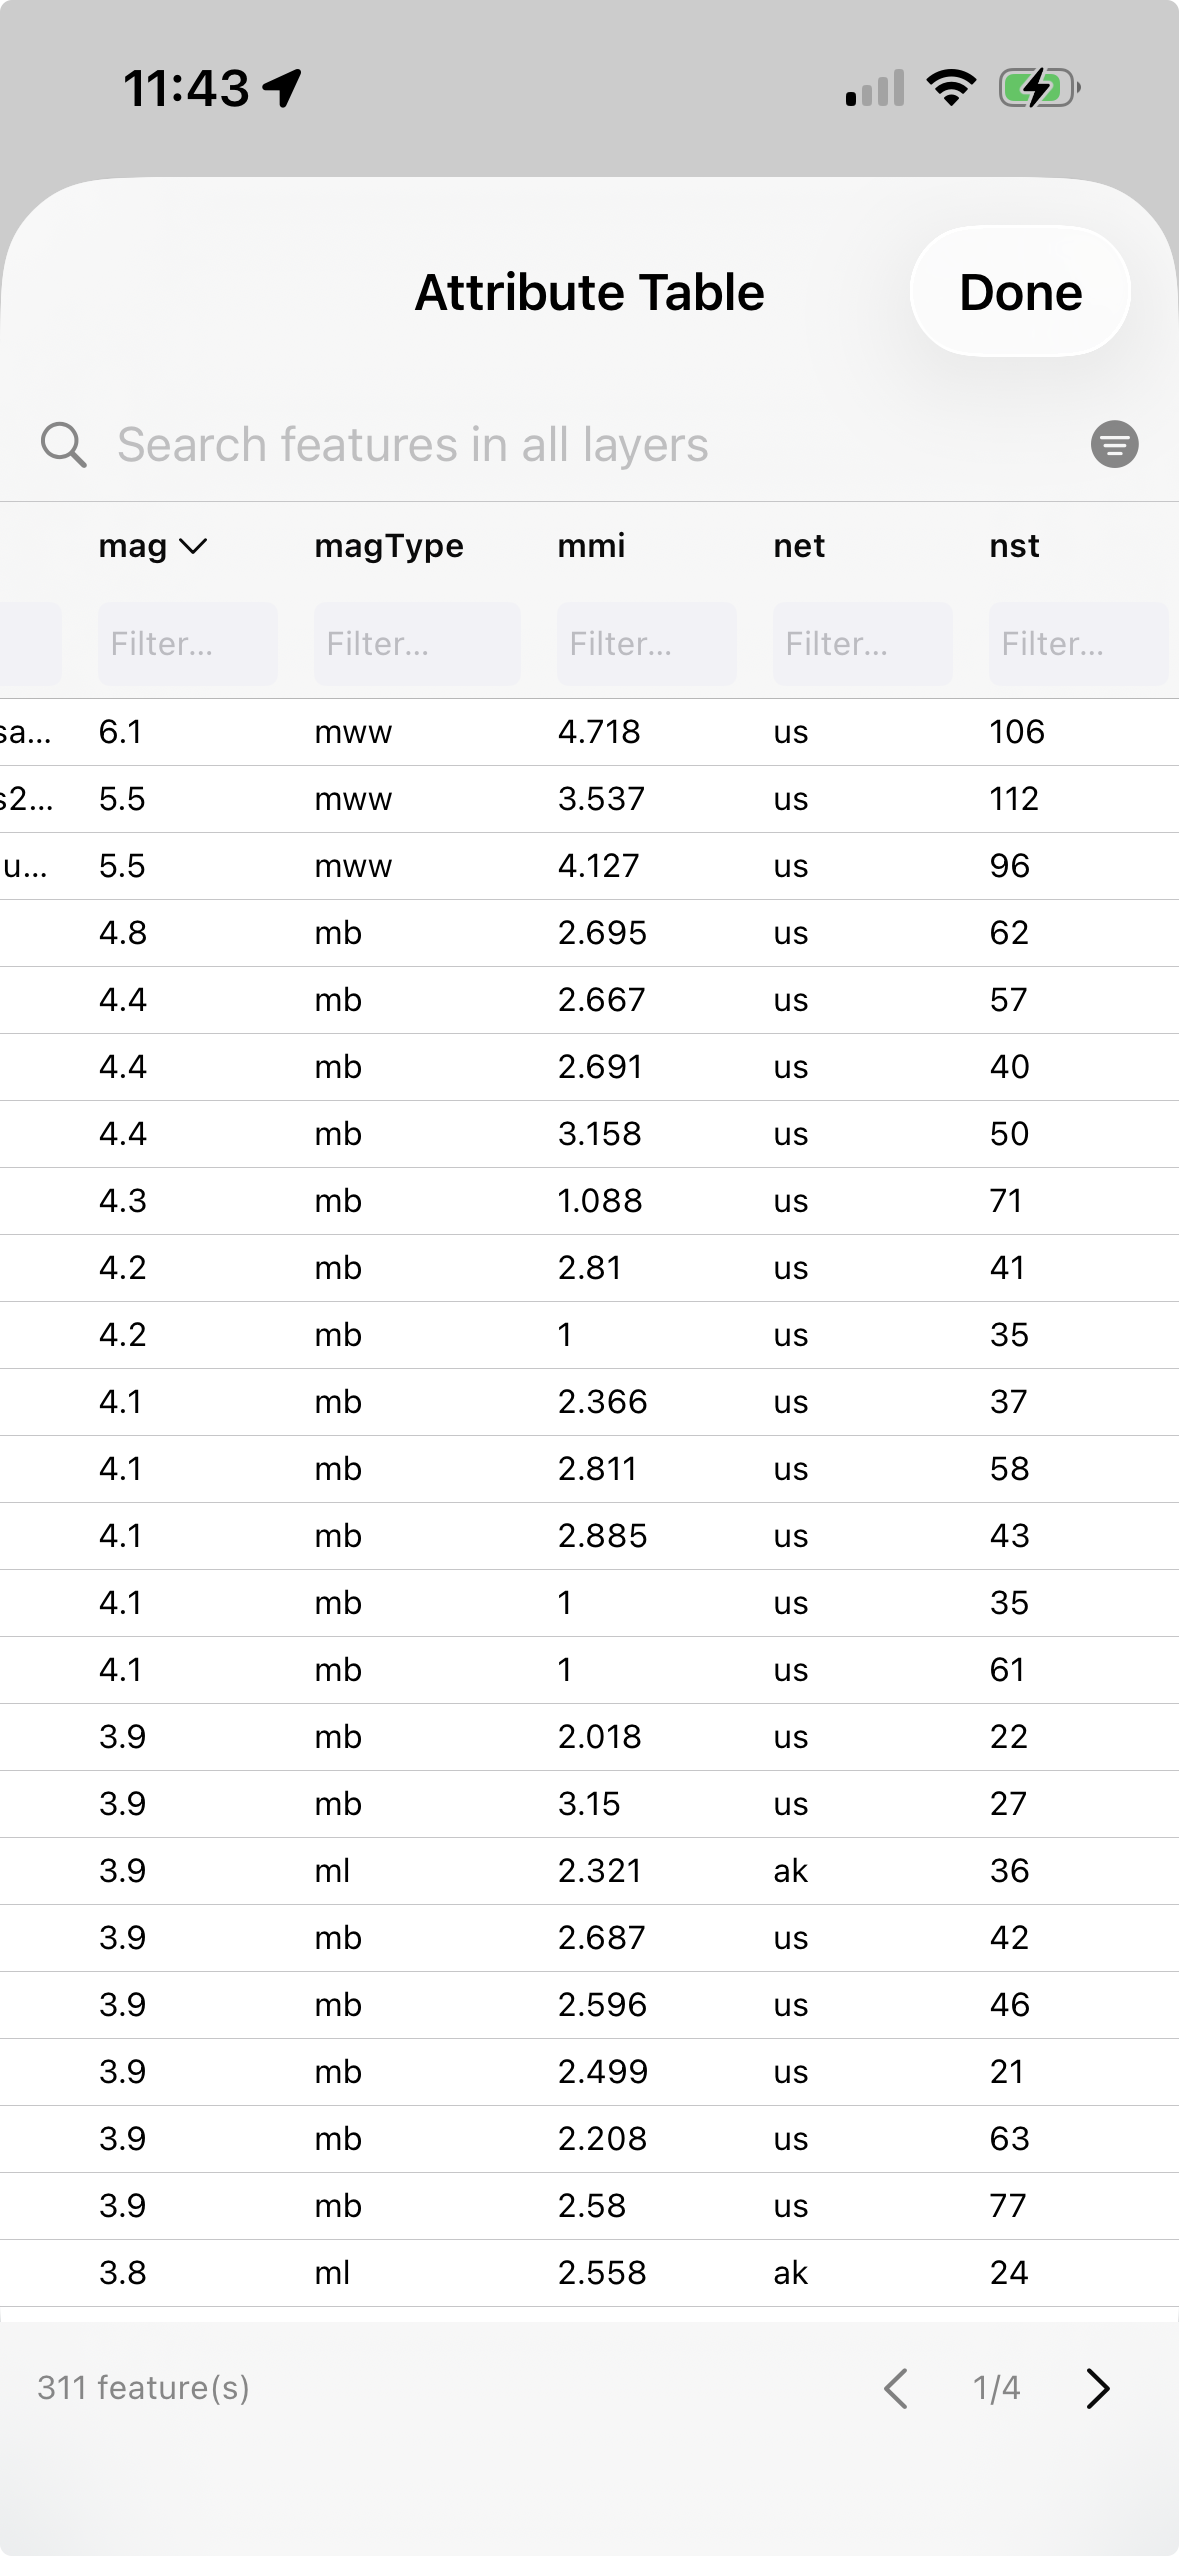
Step 6: Search and Filter with the Attribute Table
When you need to find a specific feature — a parcel by owner name, a utility pole by ID, a sample point by number — open the attribute table. It shows every feature in the layer as a row, with every attribute as a column, just like a spreadsheet.
Type in the search bar to filter across all columns. Looking for "Smith"? Every feature with "Smith" in any field shows up instantly. Tap a column header to sort by that field — tap again to reverse the order. Tap any row and the map jumps straight to that feature and highlights it.
This is where GoGIS bridges the gap between "map viewer" and "data tool." You're not just looking at shapes — you're querying your data, finding the specific features you need, and navigating to them on the ground.
What's Next?
Once you're comfortable loading and exploring your data, there's a lot more you can do:
- Collect field data — create point layers with custom forms, GPS coordinates, photos, and barcode scanning.
- Build custom forms — design pick lists, date fields, photo capture, and signature fields for structured data collection.
- Download reference data — pull in SSURGO soils, FEMA flood zones, rivers, and wetlands directly from the map.
- Handle large datasets — load county-wide parcel data with hundreds of thousands of features.
- Work offline — everything works without internet, including GPS and data collection.