Attribute Table on iPhone and iPad: Filter, Edit, Summarize and Export to Excel (CSV)
Every GIS layer is two things: shapes on a map, and a table about them. GoGIS gives that table the room it deserves on an iPhone or iPad. You can find the features you need, fix their values in the field, change a whole set at once with an Undo behind you, and hand the result to someone who works in Excel.
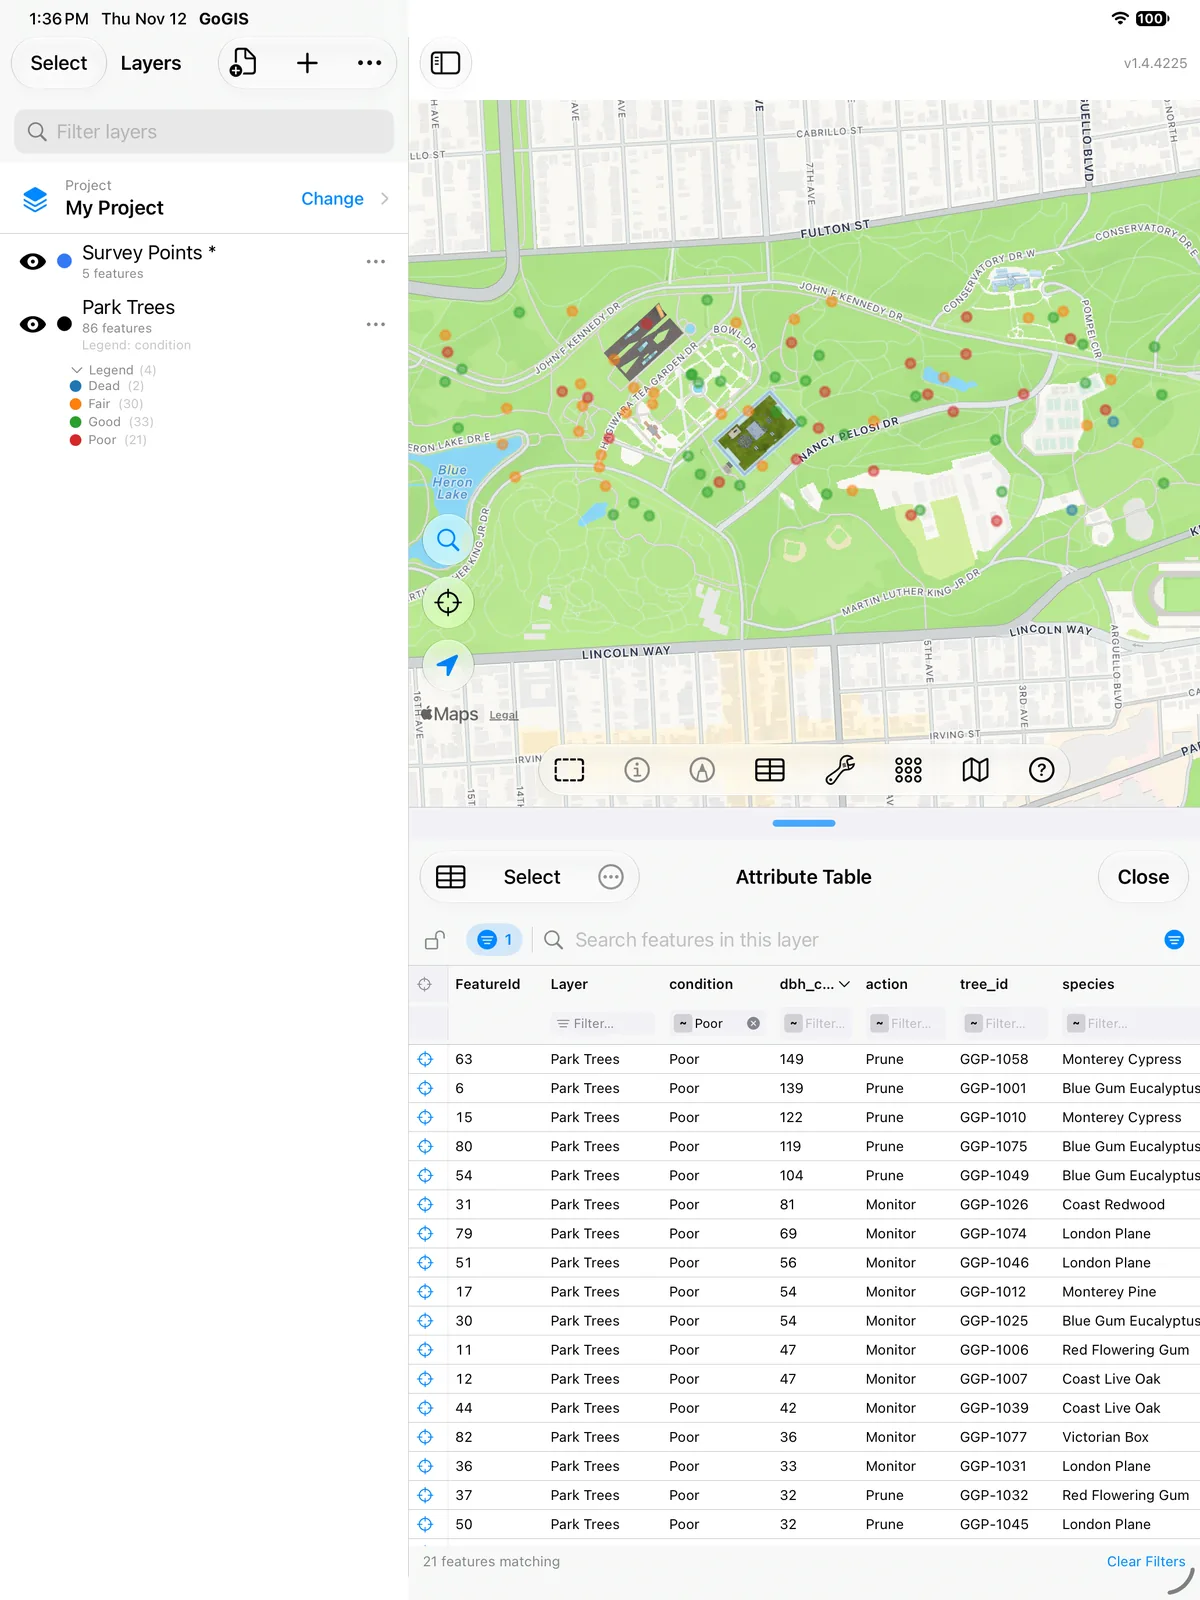
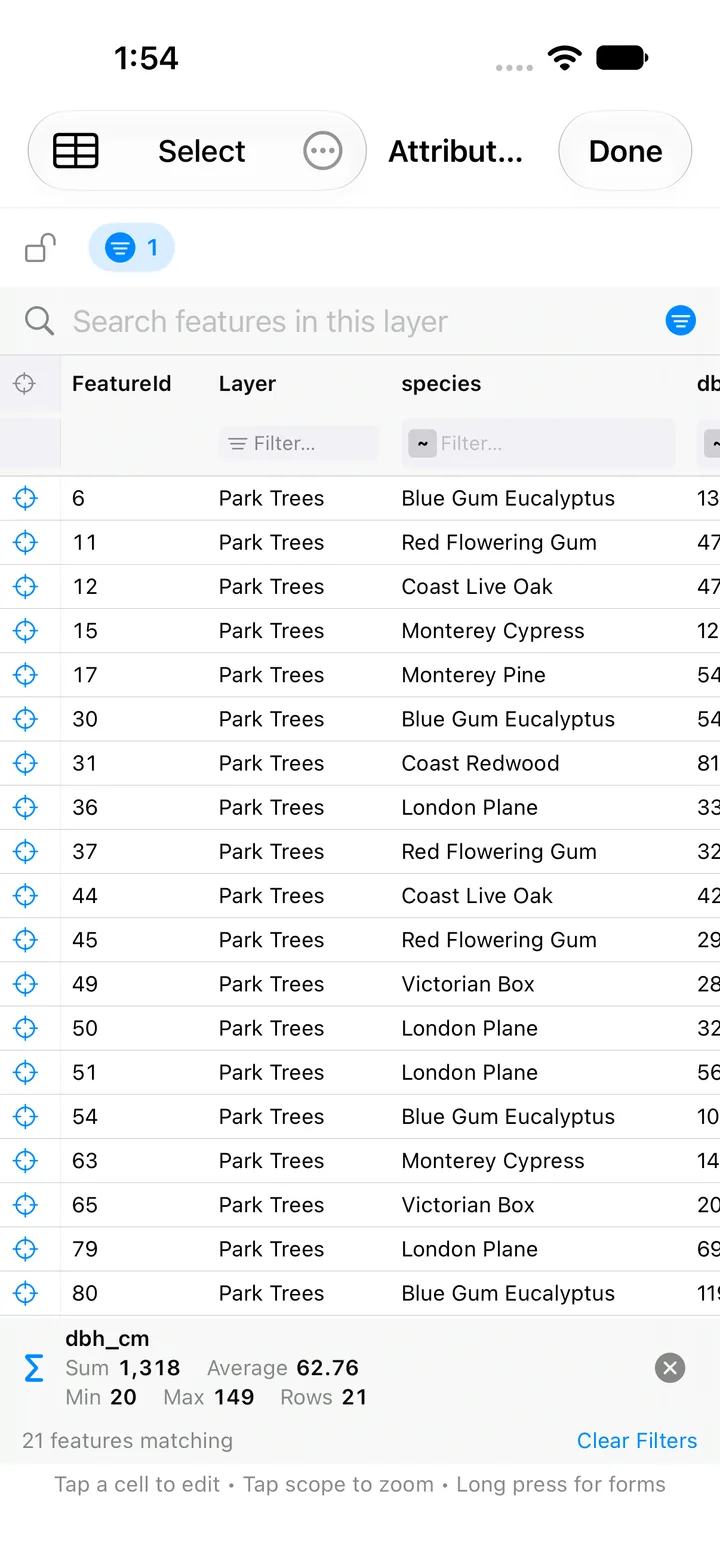
This guide goes through the attribute table one task at a time. In the app it's Attribute Table on the layer menu, and the Help calls it the Attribute Grid. The pictures show a sample inventory of 86 park trees, imported from a GeoJSON file.
What an Attribute Table Is
Each row is one feature: one tree, one parcel, one culvert. Each column, which GIS calls a field, holds one fact about every feature, such as its species, its owner or, here, its trunk diameter in centimeters (dbh_cm). A few rows of the tree inventory look like this:
| tree_id | species | condition | dbh_cm | height_m | action | inspected |
|---|---|---|---|---|---|---|
| GGP-1001 | Blue Gum Eucalyptus | Poor | 139 | 26 | Prune | 2025-07-27 |
| GGP-1004 | Monterey Cypress | Good | 123 | 27 | None | 2026-04-06 |
| GGP-1008 | Victorian Box | Fair | 39 | 7 | Monitor | 2025-01-09 |
The person who made the file chose the columns, so every table is different. If the idea is new to you, New to GIS files? explains features, attributes and the formats that carry them.
Two Ways to Open It
- From a layer. In the Layers panel, press and hold the layer, or tap its …, and choose Attribute Table. The table lists that whole layer.
- From the map toolbar. The table button opens the global attribute table, which follows the map: it shows the features in view, or only the ones you selected on the map with a tap or a fence. Its search box is different. It searches every layer in the project, not just what's on screen, and a Layer column tells you where each row comes from.
Long tables come 100 rows to a page. Your filters, sort and lock are still there when you close the table and open it again.
Filter and Select by Attributes
Under every column heading is a filter. Tap its small operator badge to choose how it compares. There are ten operators: contains, equals, not equal, starts with, ends with, greater than, less than, between, empty and not empty. Pick-list columns and the Layer column give you a list of their values to tick instead, and date columns get a date picker.
- Combine filters on several columns, for example condition equals Poor and dbh_cm greater than 80.
- The filter chip beside the toolbar shows how many filters are on. Tap it to see each one, remove one, or clear them all.
- The search bar looks through every column at once. It's the quick way to find a tree ID or an owner's name.
- Sort by tapping a heading, and tap again to reverse it.
- Lock the table with the padlock to freeze the set of features while you pan the map. You can still filter and sort inside the locked set.
- Zoom to a row with its zoom button: the map goes to that feature and opens its attributes.
That is select by attributes. Filter the table to the features you mean, then tap Select and All, the button that shows the number of matches (for example All 86), to take every matching row, ready for the next step.
Edit Cells Like a Spreadsheet
Tap any editable cell and change it where it is. The editor fits the field:
- Text, numbers, dates and yes/no toggles, typed or picked in place.
- Pick lists, chosen from the list the layer's form defines, so values stay consistent.
- Barcode and QR scan on fields set up for scanning, for sample bags and asset tags.
- Photos, signatures and field sketches: tap the cell to add, replace or delete one without opening the feature's form.
- Related-form tables: inspections and other repeat visits have their own tabs next to Attributes in the same table, and they edit the same way. See related forms.
The layer's field rules still apply. A value the form wouldn't accept, such as a blank in a required field, is refused with the reason, so the table can't be used to slip bad data past the form.
Change Many Features at Once, and Undo
When a whole set of features needs the same value, don't edit them one at a time:
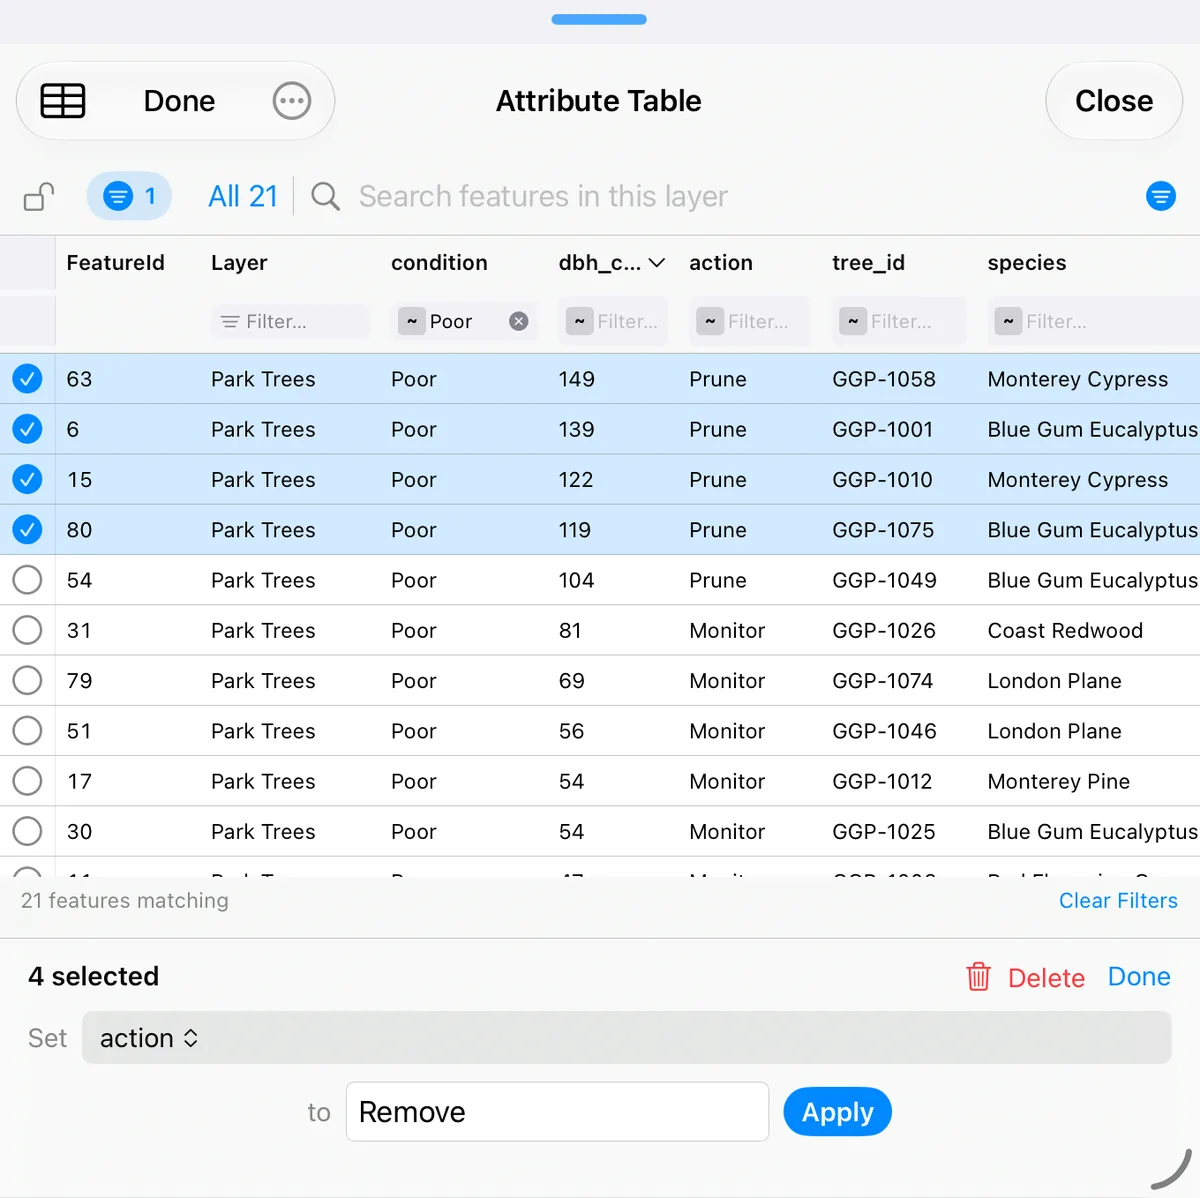
- Tap Select, then check the rows you want, or tap All with the match count, for example All 86, to take every row that matches your search and filters.
- In the bar at the bottom, choose the column after Set.
- Enter or pick the value after to, then tap Apply.
Every selected feature changes in one go. If the field's rules refuse the value on some rows, those rows are left as they were and the table tells you how many and why. The same Select mode can also Delete the selected features. Tap Done to leave it.
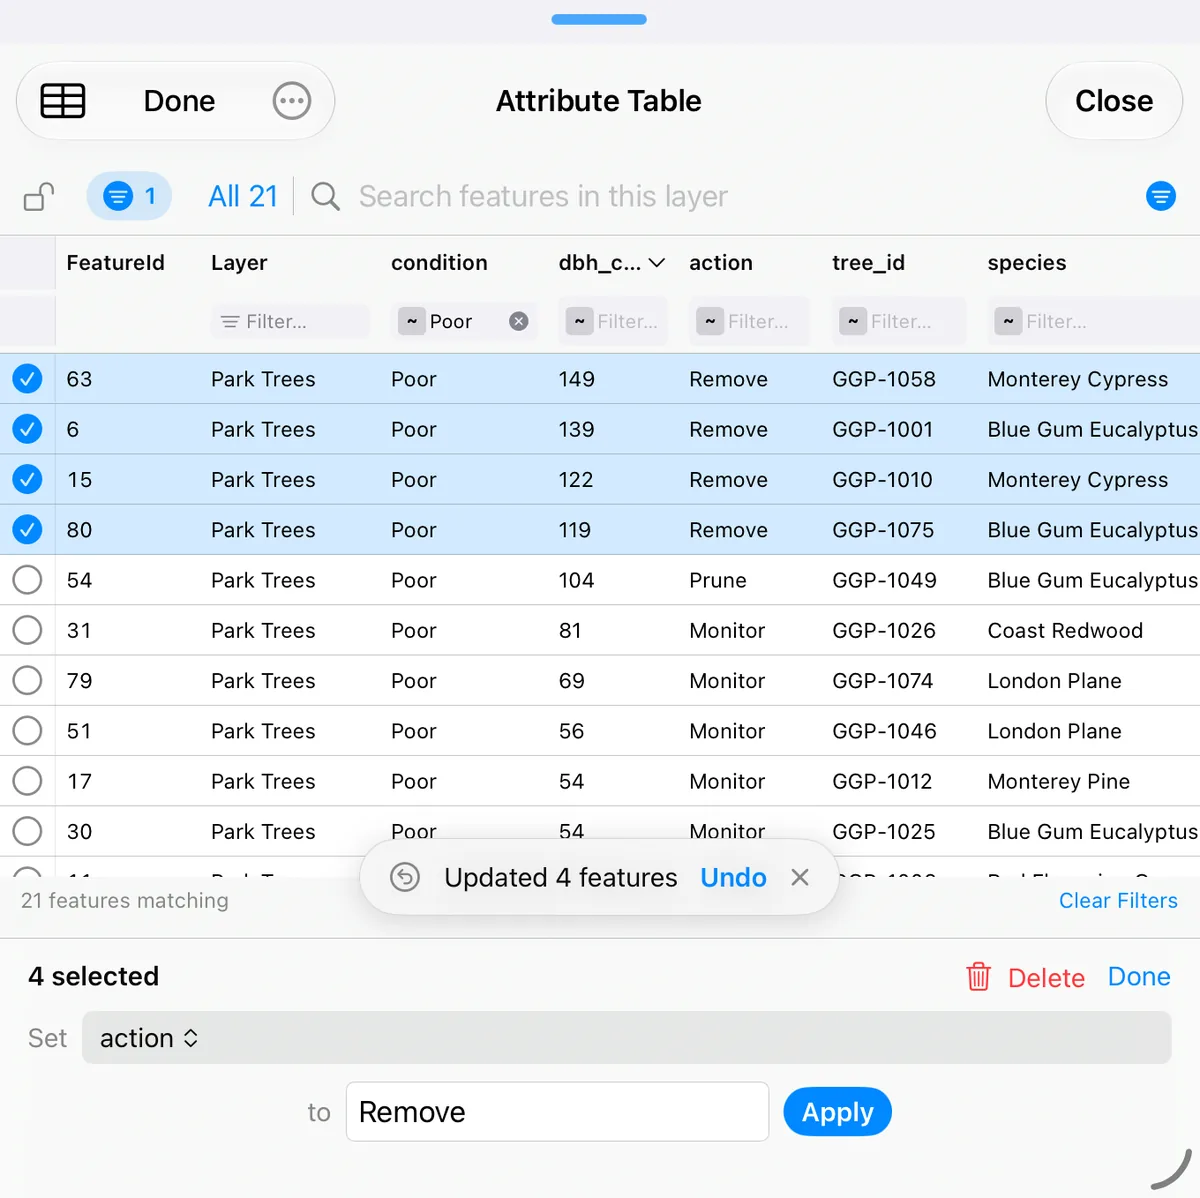
After a cell edit, a change to many rows, a photo change or a delete, an Undo button appears for a moment. It takes back the last change in one step, however many features it touched. It's one step back, not a full history. While a big change, Undo or delete is being written, the table shows Updating… and holds still until it's done, and a large Undo counts the features it restores.
Calculated Fields That Update Themselves
GoGIS isn't a spreadsheet you type formulas into, cell by cell. You give a field a formula once, and the app keeps that column right on every feature from then on. That's what a calculated field, or a field calculator column, is for.
To set one up, tap the layer's …, open Base Attributes, and tap f(x) on the field. A formula can add, subtract, multiply or divide other fields, take their sum, minimum or maximum, join text, count the days between two dates or since a date, or follow a custom formula. It can read the feature's own fields and the latest entry of a related form. The custom forms guide shows the formula editor step by step.
Then the table does the work. After a cell edit, or after a Set across a selection, every formula column on the changed rows is recalculated and saved. That holds for a change to thousands of rows at once too: each formula column is written in a single pass, not row by row. Undo puts the calculated values back along with the values you changed.
A few rules make the results predictable: a blank input counts as 0, dividing by zero gives a blank, and a formula refers to fields by their internal name, so renaming a field's label doesn't break it.
Summary Statistics for a Column
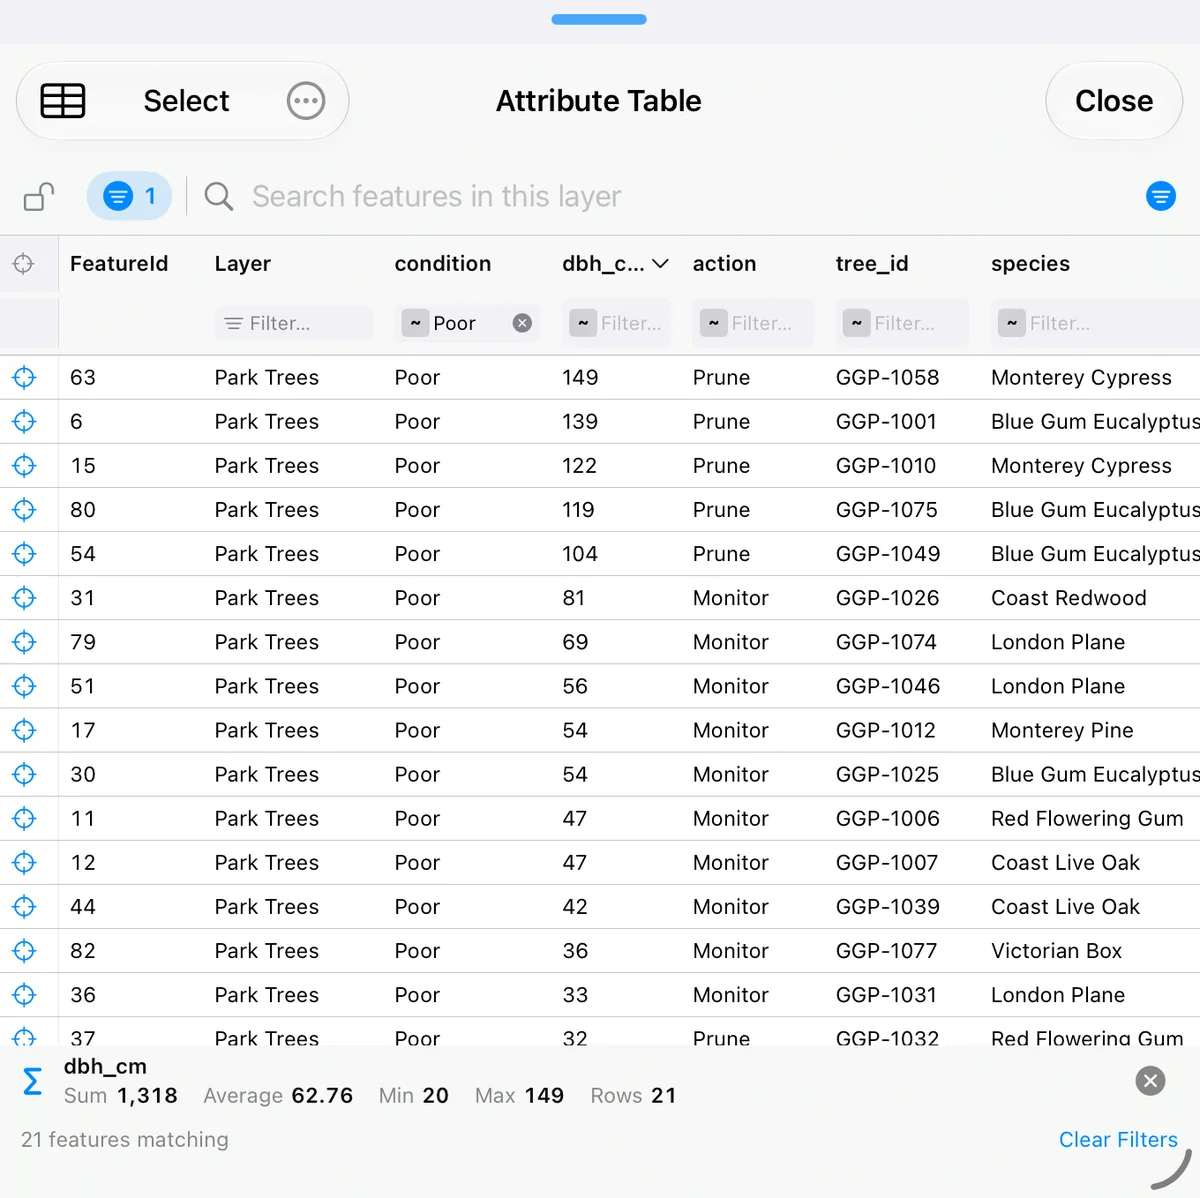
Press and hold the heading of a number column and choose Summarize. A bar under the table shows the sum, average, minimum and maximum of that field, with the number of rows. The figures cover the rows you're looking at, so they follow your search and filters as you change them. Filter to one species and you have its average diameter.
The same heading menu styles the map. Color Map by This Column colors a number field in five classes from yellow to red, or gives each value of a text field its own color, up to 30 values. Label Map with This Column writes the value beside each feature. Both make an ordinary legend or label that you can adjust later in Layer Style. They're on tables opened from a single layer.
Hide Columns, Move or Copy Features to Another Layer
- Hide a column you don't need from the same heading menu. Show All Columns in the … menu brings them back. Hidden columns stay out of the CSV too.
- Move or copy features to another layer from the … menu, either the rows you selected or the whole filtered set. Choose an existing layer or create a new one. The layer picker is organized by folder. Attributes and photos come along.
Export the Attribute Table to CSV and Excel
The CSV button (the small table icon) exports the table as you see it:
- every row that matches your current search, filters and sort, not just the page on screen;
- the columns you have showing, in the order you have them, after a feature ID and the layer name.
Excel, Numbers and Google Sheets open the CSV directly, so this is how you get a shapefile's attribute table into Excel, or a KML into Excel, from an iPhone. Filter first and the spreadsheet holds just the rows you need. On a related-form tab, the button exports that tab's entries the same way. For a layer of more than 50,000 features, search or filter first: the CSV button exports the matching set.
When the shapes have to go too, export the layer itself as a Shapefile, GeoPackage, GeoJSON, KML or CSV from the layer's menu.
Shapefile, GeoPackage and KML Attributes
- Shapefile. The attribute table of a shapefile lives in its .dbf file. GoGIS reads it when you open the shapefile's ZIP, so you can edit the shapefile's attributes in the table and export a new shapefile, .dbf included, without a desktop GIS. See how to open a shapefile.
- GeoPackage. Every table in the .gpkg becomes a layer with its own attribute table, so GoGIS works as a GeoPackage viewer and editor in one. See importing GeoPackage.
- KML and KMZ. Many KML files keep their attributes inside each placemark's description as a little table. GoGIS turns those into real columns, so you can filter, sort and edit KML attributes like any others, and its colors become the layer's legend. See the KML and KMZ guide.
Looking for a DBF viewer on a Mac? GoGIS runs on Macs with Apple silicon, and opens a shapefile's attribute table there the same way: see GIS software for Mac.
Map and Table Side by Side on iPad
On iPad, the attribute table opens under the map, so you can work with both at once:
- Resize by dragging the handle between them. Let go near the top and the table covers the map, near the bottom and it shrinks to its title and search bar. Double-tap the handle for full height, and again for half.
- The global table follows the map. Pan or zoom and it shows what's in view. Select features on the map, by tap or fence, and it shows just those. Tap empty map to go back to everything in view. A table opened from a layer always lists that whole layer.
- A row's zoom button zooms to the feature and opens its attributes, and the table stays as it is. The zoom column, or the checkboxes in Select mode, stays in view while you scroll sideways through many columns.
- Your rows hold still when the table is locked, filtered or searched, even as you move the map.
If the window is too narrow, for example in Split View, the table opens full screen and moves back under the map when there's room again.
On iPhone
On iPhone, the table opens full screen, with the same filters, editing, Select and column summary. A row's zoom button closes it, zooms the map to that feature and opens its attributes.
Questions
Can I edit a shapefile's attribute table on an iPhone without a computer?
Yes. Open the shapefile's ZIP in GoGIS from Files, email or AirDrop, then open its attribute table and tap a cell to change it, or change many rows at once with Select. When you're done, export the layer as a shapefile, with a new .dbf, and share it. No computer is involved at any step.
Can I open the attribute table in Excel?
Yes, as a CSV. The CSV button in the attribute table exports every row that matches your search, filters and sort, with the columns you have showing, in their order. Excel, Numbers and Google Sheets open it directly.
Does the attribute table work offline?
Yes. Your layers are stored on the iPhone or iPad, so searching, filtering, editing, summarizing and exporting to CSV need no connection. Only the basemap behind the map needs a connection, or a download made beforehand: see offline maps for fieldwork.
Can I change one field for many features at once?
Yes. Tap Select, check the rows you want or tap All, which shows the number of matching rows (for example All 86), to take every row that matches your filters, choose a column, enter the value and tap Apply. Every selected feature changes together, and Undo takes the whole change back in one step.
Can a column calculate itself?
Yes. Give the field a formula once, with the f(x) button in the layer's Base Attributes, for example a total from two other fields or the days since a date. After that, the table recalculates it on every row you change, including a change to thousands of rows at once.
Related Guides
- Getting started with your data: import a file, style it, label it and search it.
- Custom data collection forms: pick lists, formulas and field rules.
- Related forms: repeat inspections and visits attached to one feature.
- Loading large shapefiles: county-wide layers with hundreds of thousands of features.
- Buffer, intersect, difference and dissolve: new layers, each with its own table.
Work with your attribute tables in the field
GoGIS for iPhone, iPad, Macs with Apple silicon, and Android.
Get GoGIS on the App Store Get GoGIS on Google Play